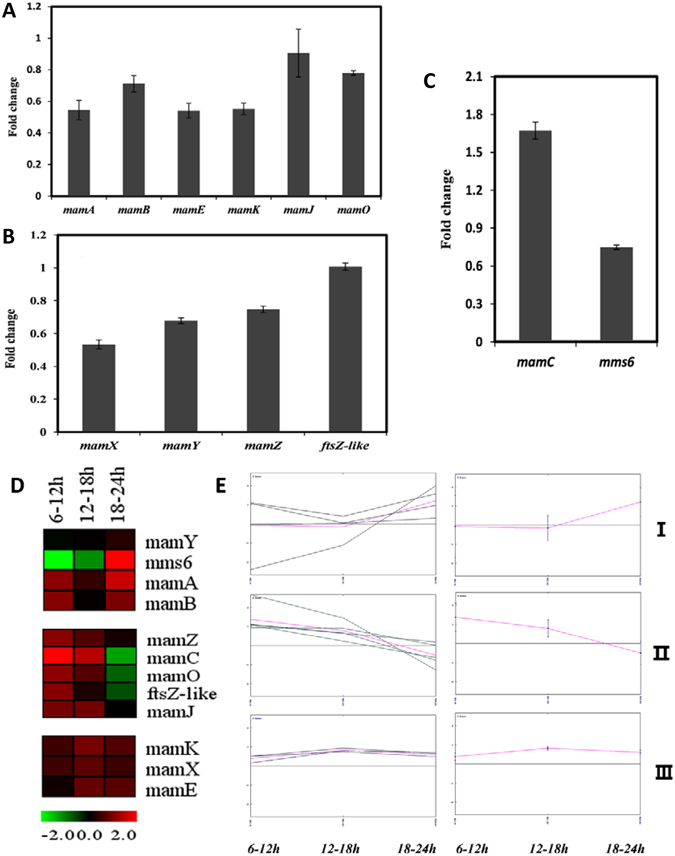
Figure 6.

Expression patterns of mam and mms genes under high- and low-iron conditions. (A,B,C) Fold changes of expression of mamAB operon, mamXY operon, mamC, and mms6 at 18 h. No clear expression differences for 12 MAI genes were observed under the two conditions at 18 h. (D) Representation of “expression rules” from the Multi Experiment Viewer program, V. 4.8.1. The expression matrix is a false-color view on a red-green scale (green = low expression; red = high expression). (E) K-means clustering shows a consistent trend of expression for members of each cluster. Twelve MAI genes increased at the earlier log phase (6–12 h) of magnetosome formation. The products (proteins) of these genes are located on magnetosome membrane, and may be involved in cell growth and magnetosome formation at the lag phase (0–6 h).
