
Figure 4.
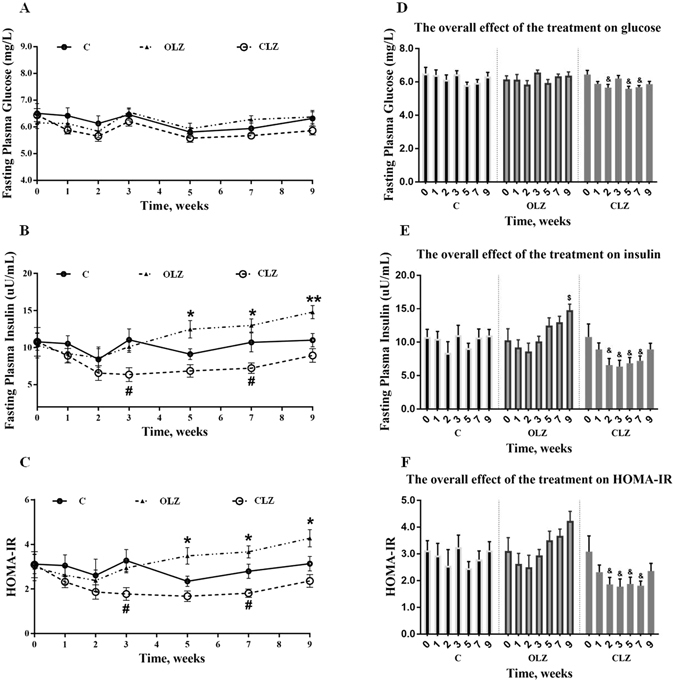
Chronic drug treatment led to progressive changes in blood glucose metabolism. Time course (mean ± SEM) of fasting plasma levels of glucose (A), insulin (B) and HOMA-IR (C) during chronic drug treatment. The overall effect of the treatment on glucose (D), insulin (E), and HOMA-IR (F) using time as repeated measure and compared with the baseline on Week 0 of each group. Animals received OLZ, CLZ, or cookie dough alone (control), as indicated. Data represent mean ± SEM (n = 12 per group). *p < 0.05 and **p < 0.01: OLZ treatment vs. control, # p < 0.05 and ## p < 0.01: CLZ treatment vs. control. $ p < 0.05, $$ p < 0.01, and $$$ p < 0.001: OLZ treatment vs. the baseline of OLZ group. & p < 0.05 and &&& p < 0.001: CLZ treatment vs. the baseline of CLZ group. C: control; O: OLZ; Cl: CLZ.