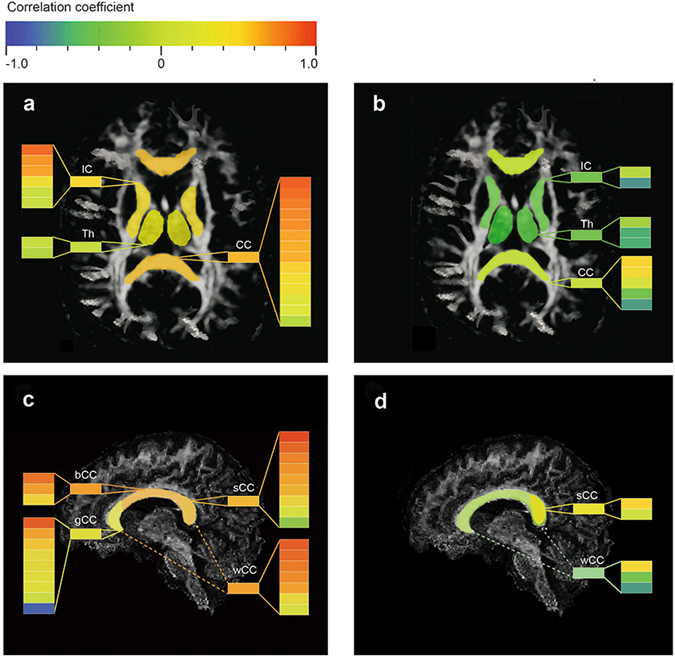
Figure 5.

Colour-bar maps to visualize correlation coefficients in regions of interest. Positive correlations are shown in hot colours while negative correlations in cool colours. Each colour bar within a column represents a single study, and the colour bar before the column reflects pooled data after meta-analysis. (a) Colour-bar map reflecting FA-consciousness correlations in several brain regions. (b) Colour-bar map reflecting ADC-consciousness correlations in several brain regions. (c) Colour-bar map reflecting FA-consciousness correlations in subareas of the CC. (d) Colour-bar map reflecting ADC-consciousness correlations in subareas of the CC. CC, corpus callosum; IC, internal capsule; Th, thalamus; CS, centrum semiovale; sCC, splenium of corpus callosum; bCC, body of corpus callosum; gCC, genu of corpus callosum; wCC, whole corpus callosum.
