Figure 7.

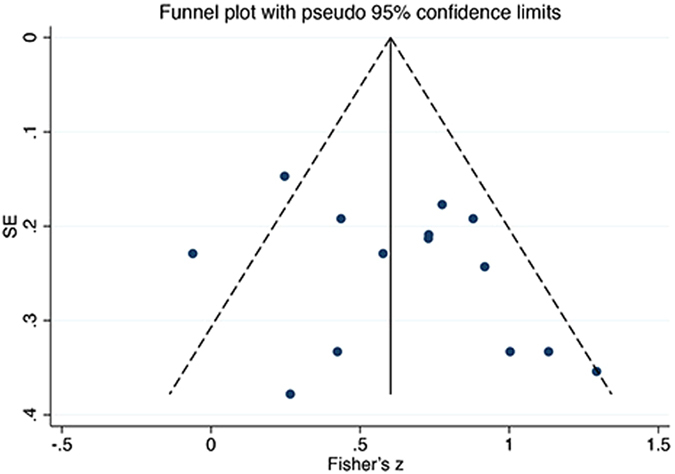
Funnel plot of pooled correlations between FA and consciousness in the CC. To draw the funnel plot, correlation coefficient values were converted into Fisher’s z values which fitted normal distribution. SE, standard error.

Funnel plot of pooled correlations between FA and consciousness in the CC. To draw the funnel plot, correlation coefficient values were converted into Fisher’s z values which fitted normal distribution. SE, standard error.