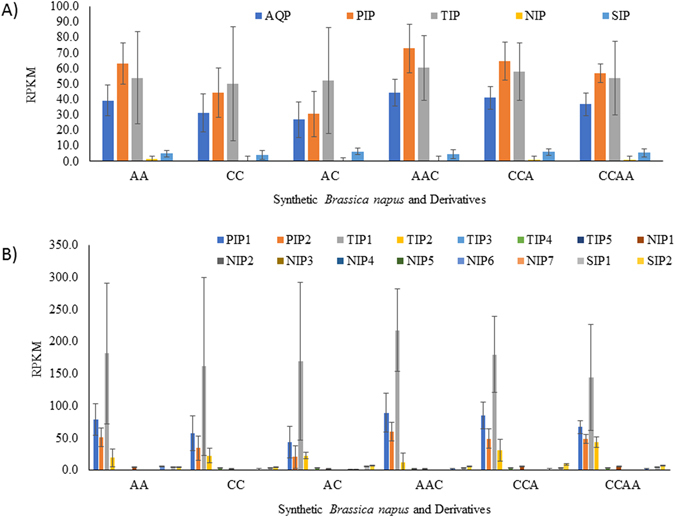
Figure 9.

Expression of aquaporins (AQPs) in B. rapa (A genome, 2n = 20) and B. oleracea (B genome, 2n = 18) parents and their synthesized progenies with different copies of sub-genomes (AC, AAC, CCA, CCAA) retrieved from Bioproject PRJNA322687. Graphs are showing expression level in term of average reads per kilobases of transcript per million mapped reads (RPKM) for (A) four AQP subfamilies namely PIP, Plasma membrane intrinsic protein; TIP, Tonoplast intrinsic protein; NIP, Noduline-26 like intrinsic protein; SIP, Small intrinsic protein; and (B) groups in each subfamily. RNA-seq expression data was obtained from Tan et al. (2016). Bars represent standard error from the mean for all values within a subfamily or a group out of six samples from two biological replicates. Detailed data are provided in Supplementary Dataset 5.
