Figure 8.
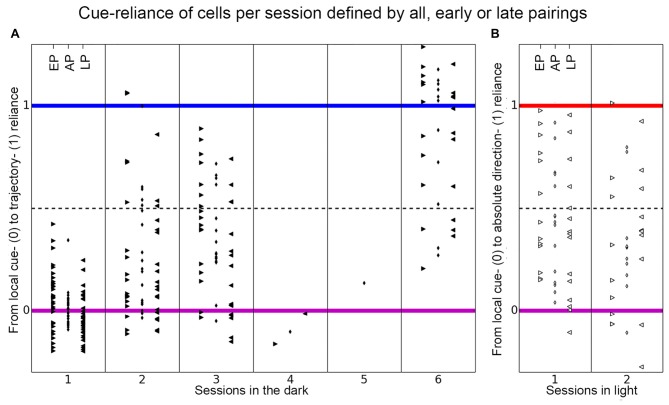
Distribution of place cell firing patterns inside the chambers separated in early, late and all pairings. The distribution of all recorded place cells is shown, separated into each session, on the axis between local cue-reliance and trajectory-reliance (A) and local cue-reliance and “absolute” direction-reliance (B) of place cell firing. The cue-reliance was defined by the composition of correlation values between trials in distinct groups of correlations. The small rhombus in the middle columns depicts the distribution of all place cells per session, if all pairings (AP) in each group of correlations were taken to calculate each cell’s cue-reliance. Arrowheads in the left columns that point to the right show the distribution of all place cells per session if only early pairings (EP) were used to define each cell’s cue-reliance, and arrowheads in the right columns that point to the left show the distribution if only late pairings (LP) were used (see Table 1 for a more detailed explanation). (A) Place cells recorded in each session in the dark distribute along the axis between local cue-reliance and trajectory-reliance of firing, separated in early, late and all pairings. There is a gradual increase of trajectory-reliance over sessions (all pairings between sessions). Within session 1 and 3 (between early and late pairings) cells became more local cue-reliant, while within session 2 and 6 no change of cue-reliance was observed. (B) Place cells recorded in each session in light distribute along the axis between local cue-reliance and “absolute” direction-reliance of firing, separated in early, late and all pairings. There was no change towards a preference for distal cues between sessions. Within session 1 cells became more local cue-reliant.

