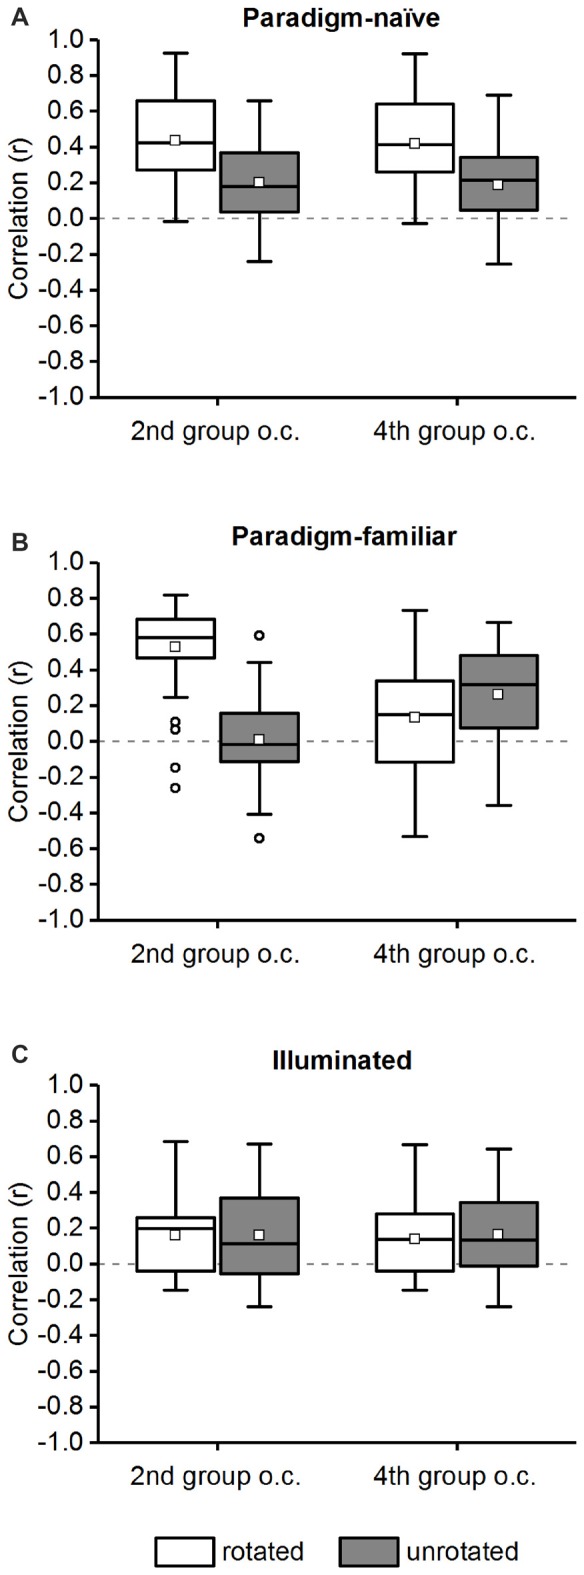
Figure 9.

Comparison of correlation values for the rotated and unrotated chamber “B” in the 2nd and 4th group of correlations. The average correlation of the 2nd and 4th group of correlations (“group o.c.”; see Table 1) is shown for chamber “B” in a rotated and unrotated configuration in the paradigm-naïve session (A), paradigm-familiar (B) and illuminated (C) sessions. The data are displayed in box plots: the bottom and the top of the box represent the first and the third quartiles (25%–75%). The band and the small square inside the box represent the median and mean. The upper tip of the whisker (vertical t-bar) depicts the maximum value and the lower tip reflects the minimum value, that is still within the 1.5 interquartile range (IQR). Values exceeding the 1.5 IQR are marked with circles. (A) In the paradigm-naïve session correlation values for the unrotated chamber “B” were significantly lower compared to those for the rotated chamber “B” in both the 2nd and 4th group of correlations. (B) In paradigm-familiar sessions correlation values for the unrotated chamber “B” were significantly lower compared to those for the rotated chamber “B” in the 2nd and significantly higher in the 4th group of correlations. (C) In illuminated sessions correlation values for the unrotated chamber “B” were not significantly different compared to those for the rotated chamber “B” neither in the 2nd nor in the 4th group of correlations.
