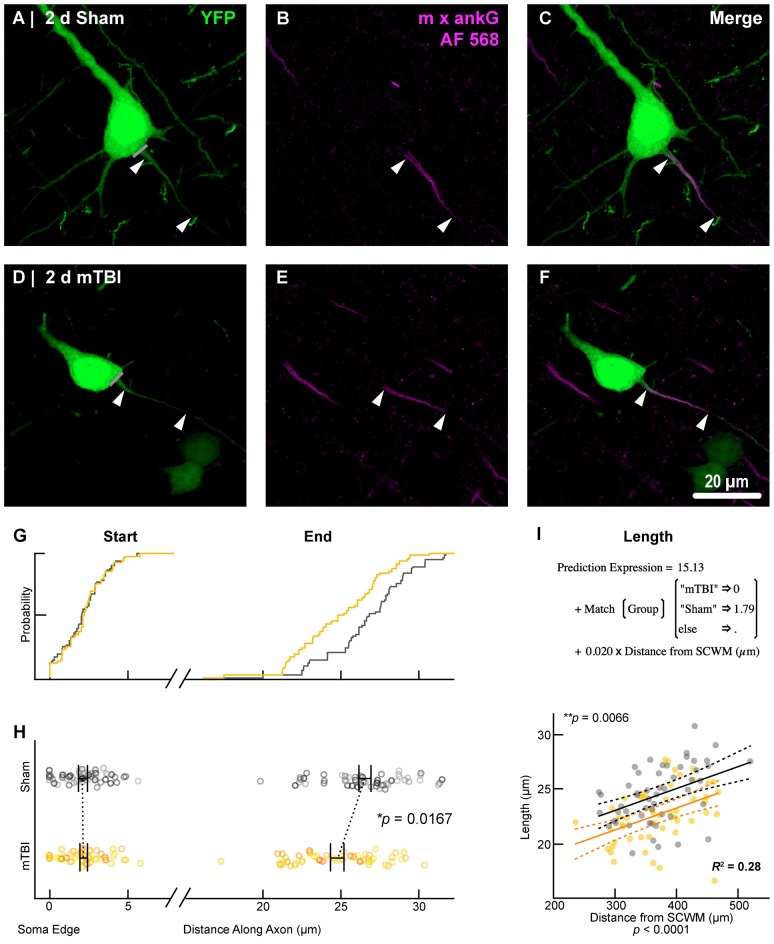
Figure 6.
AnkG length decreases from the distal AIS after 2 days post-mTBI. Representative images of sham (A–C) and mTBI (D–F) of YFP (A,D; green) and ankG (B,E; magenta). (C,F) Composite image showing YFP+ axon colocalization with ankG, demarcating the AIS. YFP traces were taken from the line drawn across the ado-somatic vertex (A,D), through and past the region of the AIS (C,F). (G–I) Quantitative analysis of ankG profiles of sham (gray) and mTBI (gold). (G) Cumulative frequency distribution plots showing overlap in start position but a proximal shift in mTBI end position. (H) Multilevel analysis of start and end positions with animals as a random variable depicted by different shades. Data summarized with means and SEM error bars. Note that there is no change in ankG start position; however, there was a significant decrease in the end position. This resulted in an overall decrease in length from the distal AIS. (I) Multilevel analysis of ankG length with animals as a random variable and distance from SCWM as a covariate. Plot of ankG length as a function of distance from SCWM (solid lines) with 95% confidence intervals (CI; dashed lines) for sham and mTBI. Note that distance from SCWM is a significant covariate of ankG length, but there is no interaction with experimental groups indicated seen as a parallel shift in lines.

