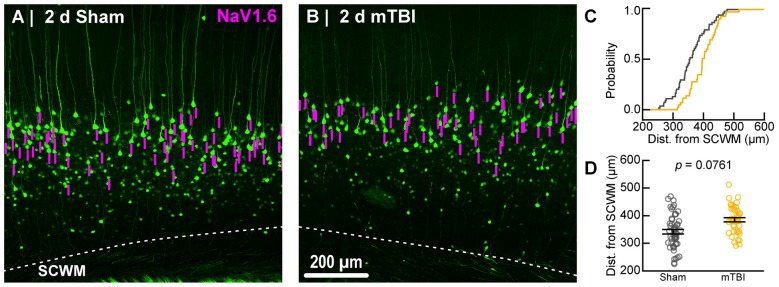
Figure 7.
Sampling distribution of intact YFP+ pyramidal neurons for NaV1.6 quantitative analysis. (A,B) Superimposed maximum intensity projections of 10× overview images for sham (A) and mTBI (B). The intact YFP+ pyramidal neuron sampling distribution (magenta bars) with respect to the SCWM appeared slightly asymmetric, with mTBI having several samples located more superficially (upper right aspect). (C) Cumulative frequency distribution plot showing mTBI (gold) samples are shifted toward increased distance from SCWM compared to sham (gray). (D) Quantitative analysis confirmed revealed there was no statistically significant difference in sampling. Statistics: multilevel analysis with animals as a random variable. Data summarized with means and SEM error bars.

