FIGURE 3.

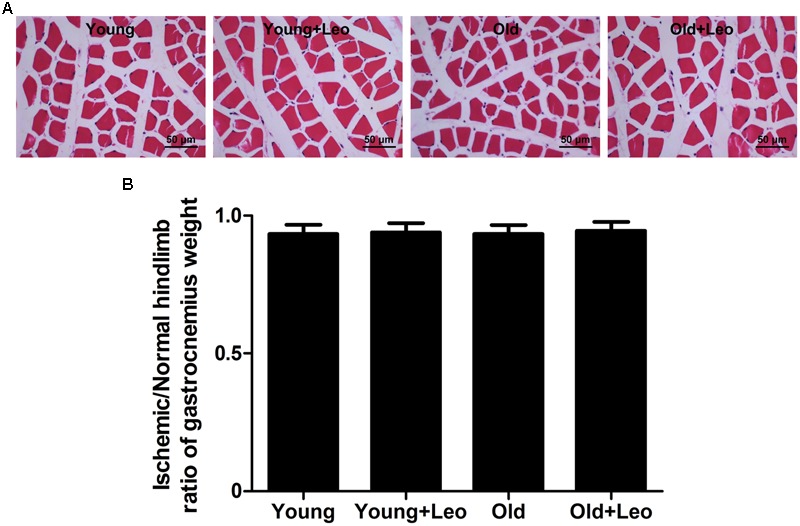
H&E-staining of ischemic hindlimb muscles of different groups. (A) Representative H&E-staining images. Scale bar = 50 μm. (B) Weight of left (ischemic) gastrocnemius muscle normalized to right.

H&E-staining of ischemic hindlimb muscles of different groups. (A) Representative H&E-staining images. Scale bar = 50 μm. (B) Weight of left (ischemic) gastrocnemius muscle normalized to right.