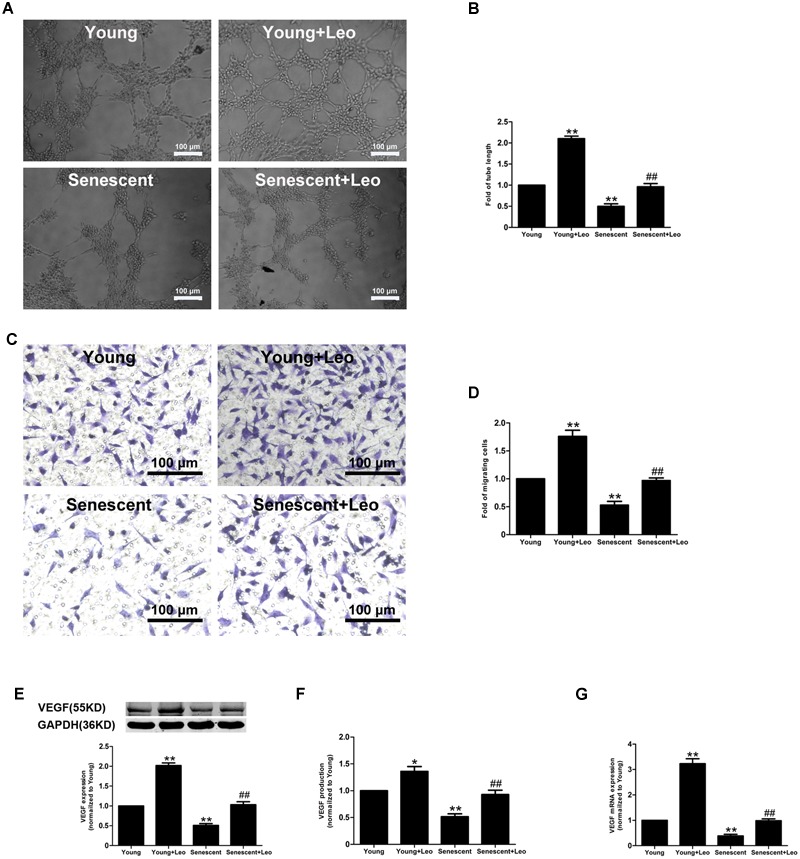
FIGURE 7.

Effects of leonurine on the endothelial functions in senescent HUVECs. (A,B) Representative micrographs and quantification of tube formation in HUVECs treated as indicated (n = 3 each). Scale bar = 100 μm. (C,D) Representative images and quantitative analysis of cell migration with migration assay in HUVECs treated as in (A) (n = 3 each). Scale bar = 100 μm. (E–G) Effects of aging and leonurine on VEGF expression, secretion and mRNA expression in HUVECs. ∗p < 0.05 vs. young group; ∗∗p < 0.01 vs. young group; ##p < 0.01 vs. senescent group. Data are mean ± SEM.
