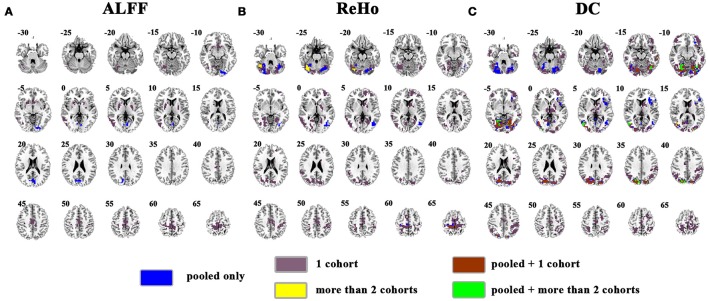
Figure 4.
Overlapped results of the pooled data and individual cohorts. (A–C) indicate the results detected by ALFF, ReHo, and DC, respectively. Blue indicates the regions detected only in pooled data. Purple indicates the regions detected only in one of the 4 cohorts. Yellow indicates the regions detected by only 2 of the 4 cohorts but not in the pooled data. Brown indicates the regions detected in the pooled data and in only one of the 4 cohorts. Green indicates the regions detected in the pooled data and 2 of the 4 cohorts. Left in the figure indicates the right side of the brain.

