Figure 4.
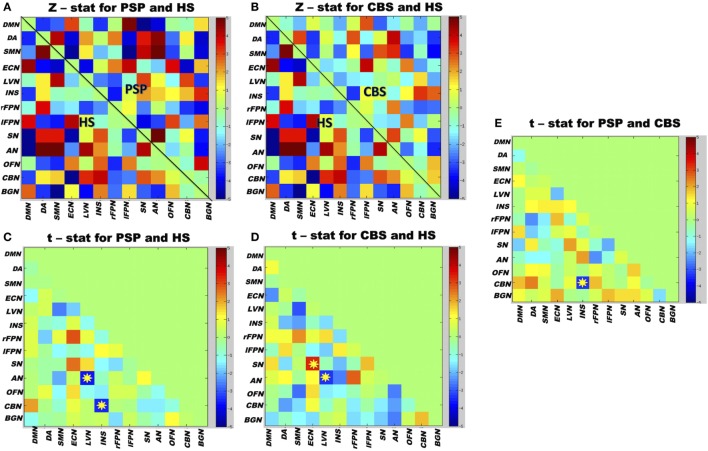
Matrix map of partial correlation obtained from 13 resting-state networks (RSNs) time courses of whole group of participants. (A) The between-network partial correlation maps in PSP and healthy subjects (HS). (B) The between-network partial correlation maps in corticobasal syndrome (CBS) and HS. (C,D) The t-test values when PSP and CBS were compared separately with HS. (E) The t-test values when both the patient groups were compared with each other. Yellow stars represent significant differences in between-network connectivity after group comparisons; color bars indicate the t-stat values. Red boxes represent increased between-network resting-state functional connectivity (rsFC), and blue boxes represent decreased between-network rsFC. The 13 RSNs: DMN, default mode network; DA, dorsal attention; SMN, sensorimotor network; ECN, executive-control network; LVN, lateral visual network; INS, insula; rFPN, right fronto-parietal network; lFPN, left fronto-parietal network; SN, salience network; AN, auditory network; OFN, orbitofrontal network; CBN, cerebellum network; BGN, basal ganglia network. Results are shown at p < 0.05, corrected for family-wise error.

