
FIGURE 8.
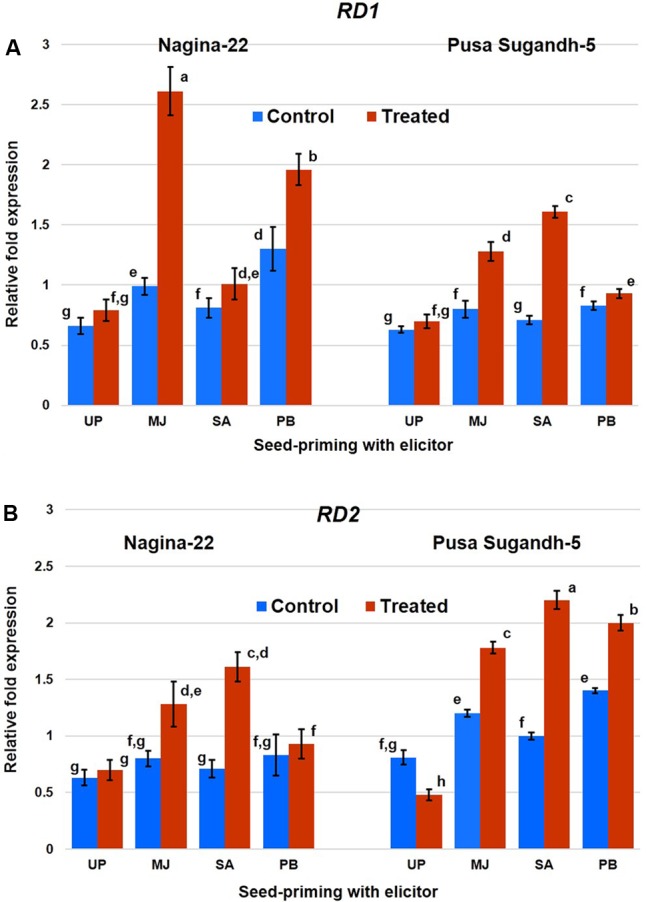
Quantitative (RT-qPCR) expression profile of (A) RD1 and (B) RD2 genes in shoot of the plants raised from the seeds of contrasting rice genotypes (Nanina-22, drought-tolerant and Pusa Sugandh-5, drought-sensitive) without priming or priming with different elicitor grown under control and drought stress (witholding irrigation for 4 days). The results are represented as mean fold change in relative expression over three biological and three technical replicates, normalized with respect to actin as housekeeping/reference gene. UP, unprimed; MJ, MJ-primed; SA, SA-primed; PB, PB-primed. Columns with different lowercase letters indicate significant difference at P < 0.05 (Duncan’s multiple range test). Bar represents the standard deviation.