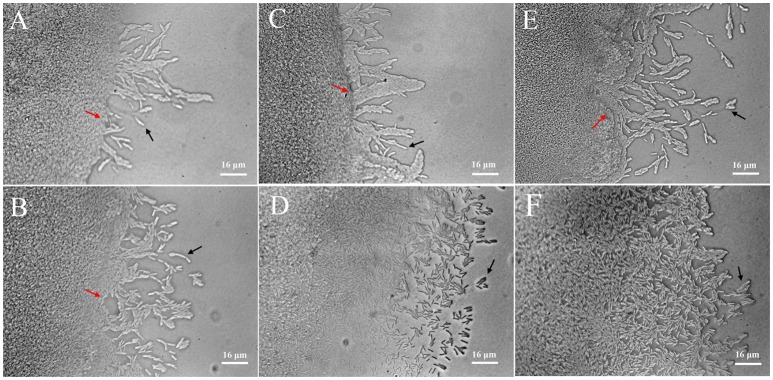
Figure 4.
Detection of twitching motility of L. enzymogenes OH11 in the presence or absence of P. aphanidermatum. L. enzymogenes monoculture (up), co-culture with P. aphanidermatum (down). (A,B), co-culture for 24 h; (C,D), co-culture for 48 h; (E,F), co-culture for 96 h. When L. enzymogenes monoculture (up), there were a small number of cells moving out, whereas more motile cells at the leading edge of the moving zone when co-culture with P. aphanidermatum (down). Red arrows indicate the colony edge, and black arrows indicate the motile cells. In (E,F), colony edge can't be seen clearly because of too many cells moving away from the edge. The areas photographed represent the outermost end of cell growth (magnification, ca. × 640).

