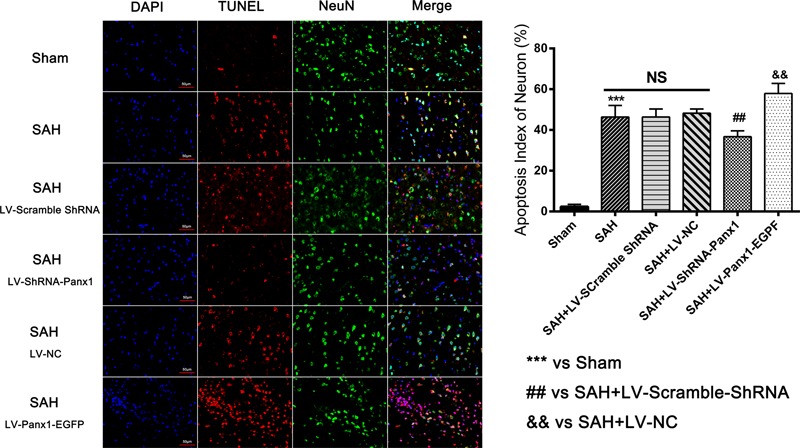
FIGURE 10.

Co-immunofluorescent staining shows that TUNEL-positive cells co-localized with the neurons marker (NeuN) in the overlapped images. It showed that the number of TUNEL-positive neurons was higher in SAH group as compared to that in Sham group. In LV-Panx1-EGFP group, the number of TUNEL-positive neurons was even much higher than SAH + LV-NC group. LV-ShRNA-Panx1 attenuates the level of TUNEL-positive neurons as compared with SAH + LV-Scramble-ShRNA group (TUNEL = red, NeuN = green, DAPI = blue, Scale bars 20 μm). Bars represent the mean ± SD (n = 6, each group; ##P/&&P < 0.01; ∗∗∗P < 0.001; NSP > 0.05).
