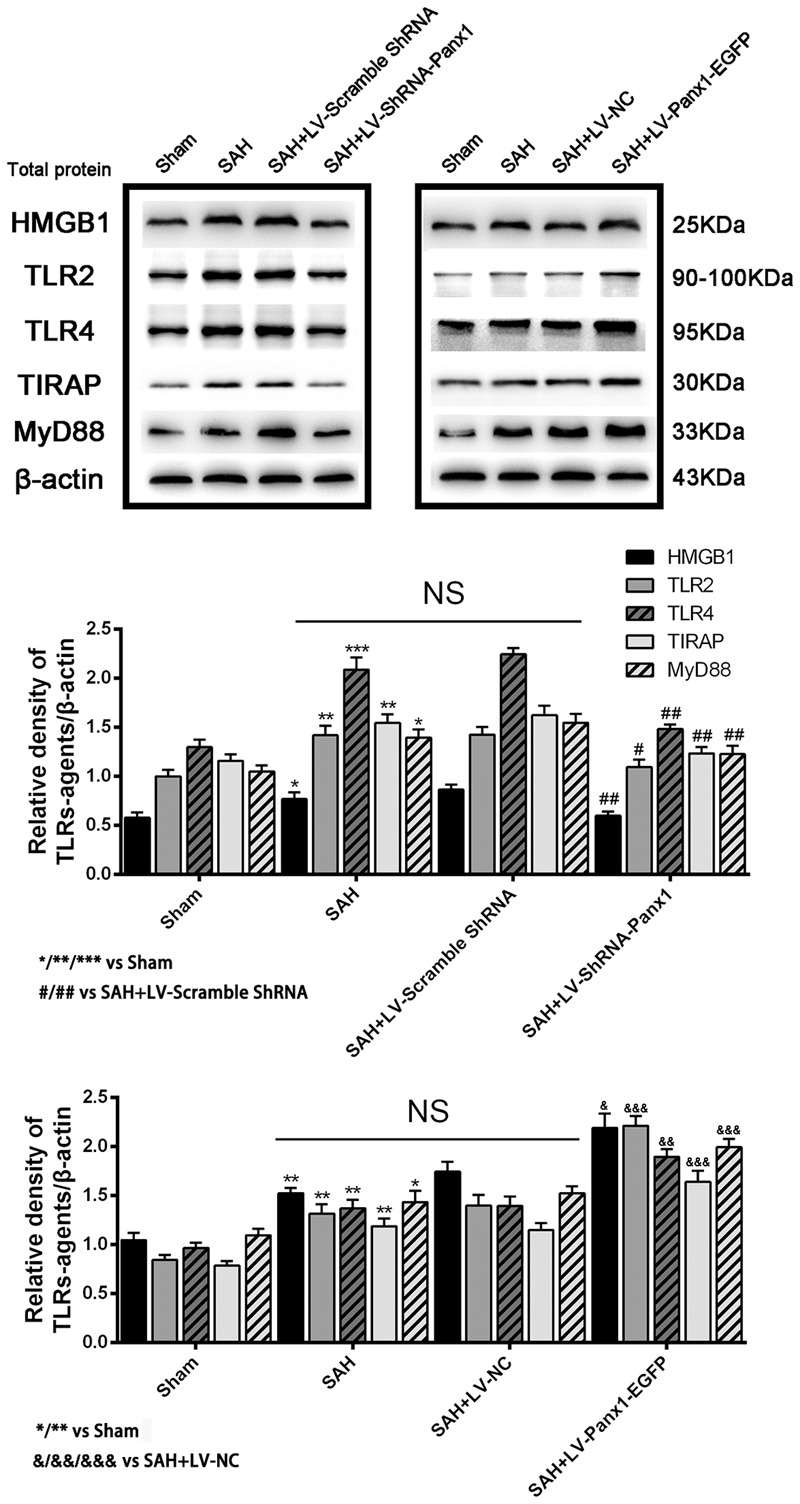
FIGURE 5.

(Upper) Representative autoradiogram of HMGB1, TLR2, TLR4, TIRAP, and MyD88 expression in the inferior basal temporal cortex after SAH. The expression of these proteins was elevated in the SAH group and further improved in SAH + LV-Panx1-EGFP group and down-regulated after LV-ShRNA-Panx1 administration. (Bottom) Quantitative analysis of the Western blot results shows that these protein levels in SAH groups are significantly higher than Sham group and depressed by LV-ShRNA-Panx1 administration. Otherwise, LV-Panx1-EGFP injection further increased these protein levels as compared with those of SAH + LV-NC group. β-actin was used as the loading control. Bars represent the mean ± SD (n = 6, each group; ∗P/#P/&P < 0.05; ∗∗P/##P/&&P < 0.01; ∗∗∗P/###P/&&&P < 0.001; NSP > 0.05).
