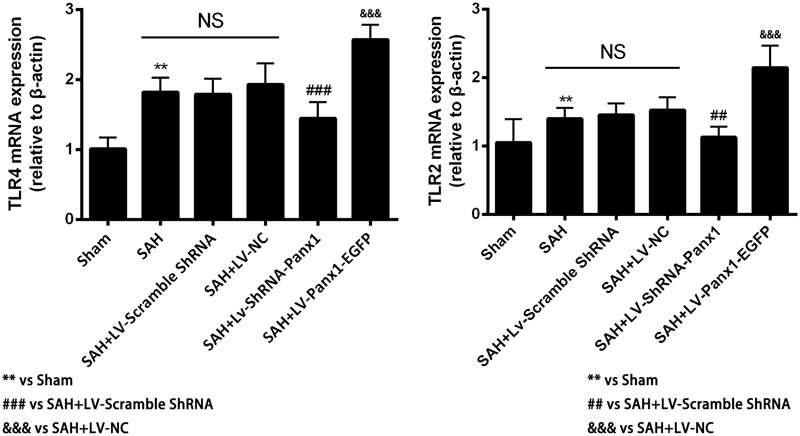
FIGURE 6.

The mRNA expressions of TLR2 and TLR4 were measured by Quantitative real-time PCR in each experimental group. The induction of SAH led to a significantly upward tendency in TLR2 and TLR4 mRNA expressions compared with Sham group. The mRNA expressions of TLR2 and TLR4 were significantly down-regulated with LV-ShRNA-Panx1 administration as compared with SAH + LV-Scramble-ShRNA group and markedly up-regulated with LV-Panx1-EGFP transfection as compared with SAH + LV-NC group. Bars represent the mean ± SD (n = 6, each group; ∗P/#P < 0.05; ∗∗P/##P < 0.01; ∗∗∗P/###P/&&&P < 0.001; NSP > 0.05).
