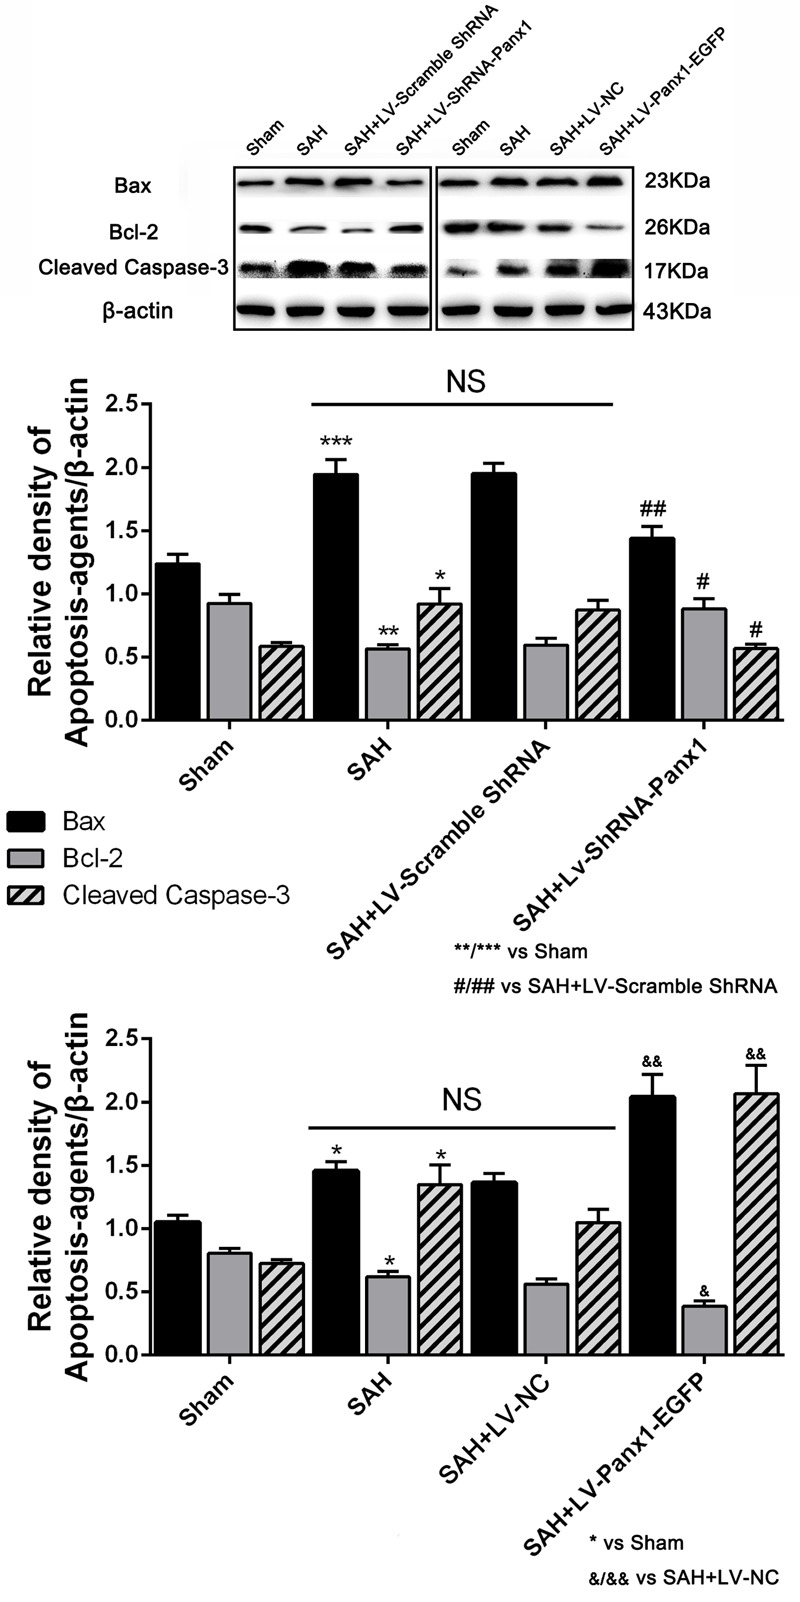
FIGURE 9.

The expression levels of apoptosis associated proteins were assessed by Western blot analysis.Quantitative analysis of representative autoradiogram of Bax, Bcl-2, and cleaved Caspase-3 shows that LV-ShRNA-Panx1 administration significantly suppressed the expression of apoptosis associated proteins as compared with SAH + LV-Scramble-ShRNA group. Likewise, in LV-Panx1-EGFP group, Bax and cleaved Caspase-3 protein levels were markedly higher than that in SAH + LV-NC group. β-actin was used as the loading control. Bars represent the mean ± SD (n = 6, each group; ∗P/#P/&P < 0.05; ∗∗P/##P/&&P < 0.01; ∗∗∗P < 0.001; NSP > 0.05).
