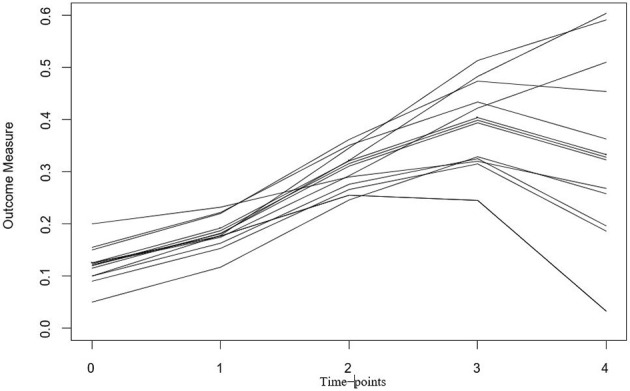
Figure 1.

Example trajectory plot for a Latent Growth Curve Model (LGCM). Each line (or trajectory) represents an individual persons growth trajectory across time. In the case of the example, this could be how the stress response (i.e., outcome measure) changes over-time across longitudinal measurements of data.
