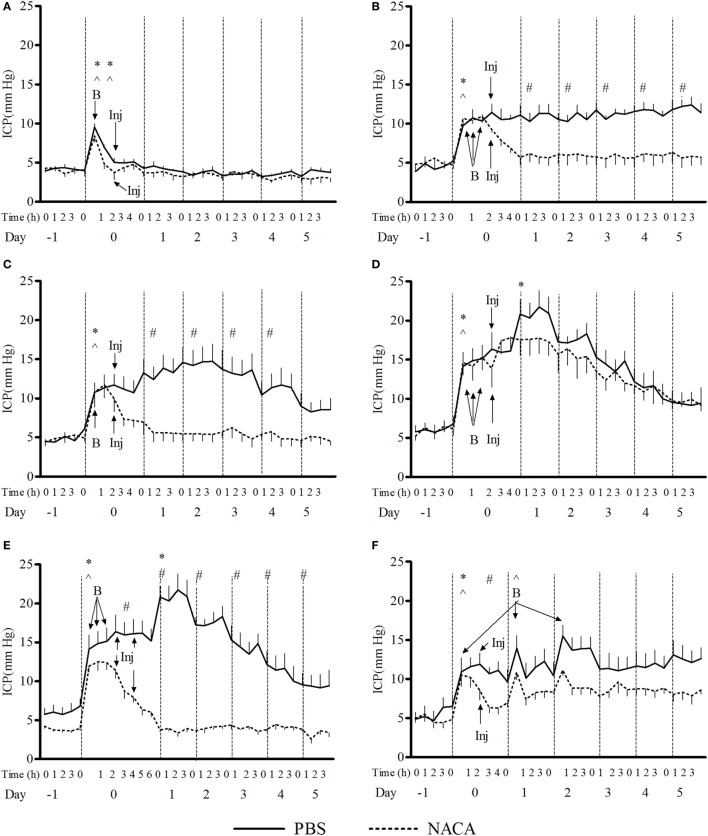
Figure 1.
Changes in intracranial pressure (ICP) with various schedules of blast overpressure (BOP) exposure. Comparison between N-acetylcysteine amide (NACA)- and phosphate-buffered saline (PBS)-treated groups when administered after BOP exposure. (A) 1 × 72, (B) 3 × 72, (C) 1 × 110, (D) 3 × 110, (E) 3 × 110-2i, and (F) 3 × 110-3d. X-axis label is not to scale. B, blast; Inj, injection of NACA/PBS. Significant difference in ICP between a given time point and the one preceding it within a group is shown by * in PBS-treated and ^ in NACA-treated groups (one-way ANOVA); and between the two groups is shown by # (two-way RM ANOVA), with p < 0.05.

