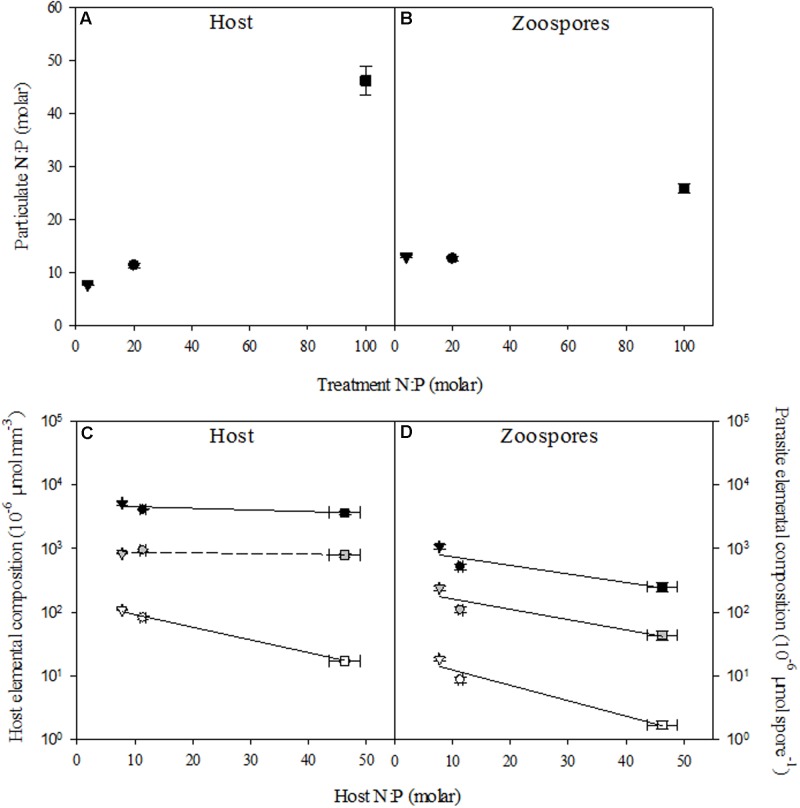
FIGURE 2.
N:P ratios of uninfected host (A) and zoospores (B), and elemental content of the host (C) and zoospores (D) in the control (circle), low N:P (triangle) and high N:P (square) treatments. Symbols represent mean ± standard error (n = 4). In (C,D) black, gray, and white symbols indicate carbon, nitrogen and phosphorus content, respectively. Solid lines indicate significant correlations (P < 0.05).

