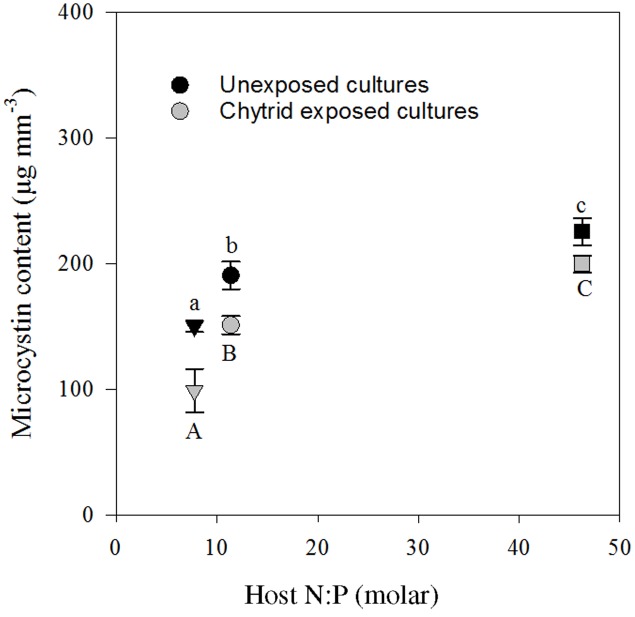
FIGURE 5.
Seston microcystin content in the cultures with and without parasite exposure, in the control (circle), low N:P (triangle) and high N:P (square) treatments. Symbols represent mean ± standard error (n = 4). Letters denote significant differences between treatments of unexposed (lower case) and chytrid exposed (upper case) cultures based on One-way ANOVA and post hoc comparison of the means (α < 0.05).

