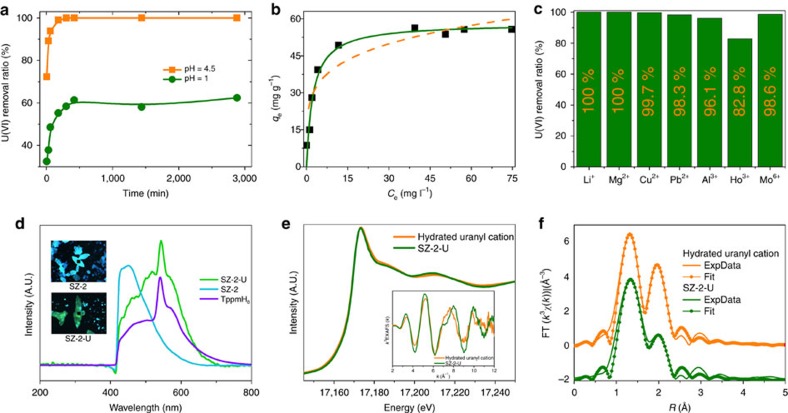
Figure 7. Uranyl sorption experiment results using SZ-2.
(a) Effect of contact times on uranyl(VI) sorption onto SZ-2 at pH 4.5 and 1.0 under stirring, with C0=10 p.p.m., mV−1=1 mg ml−1; (b) the sorption data fitted by Langmuir (green solid) and Freundlich (yellow dash) models at pH=4.5, respectively; (c) competitive sorption of coexistent ions on SZ-2 at pH=4.5, with molar ratio of metal ions to uranyl cations are ∼10 times; (d) fluorescence spectra of SZ-2 (blue) and SZ-2-U (yellow-green) excited by 365-nm light before and after uranyl adsorption; (e) XANES and EXAFS (inset) spectra of SZ-2-U, compared with the hydrated uranyl cation in aqueous solutions; (f) Fourier-transformed space (R space) spectra of SZ-2-U, compared with the hydrated uranyl cation in aqueous solution.

