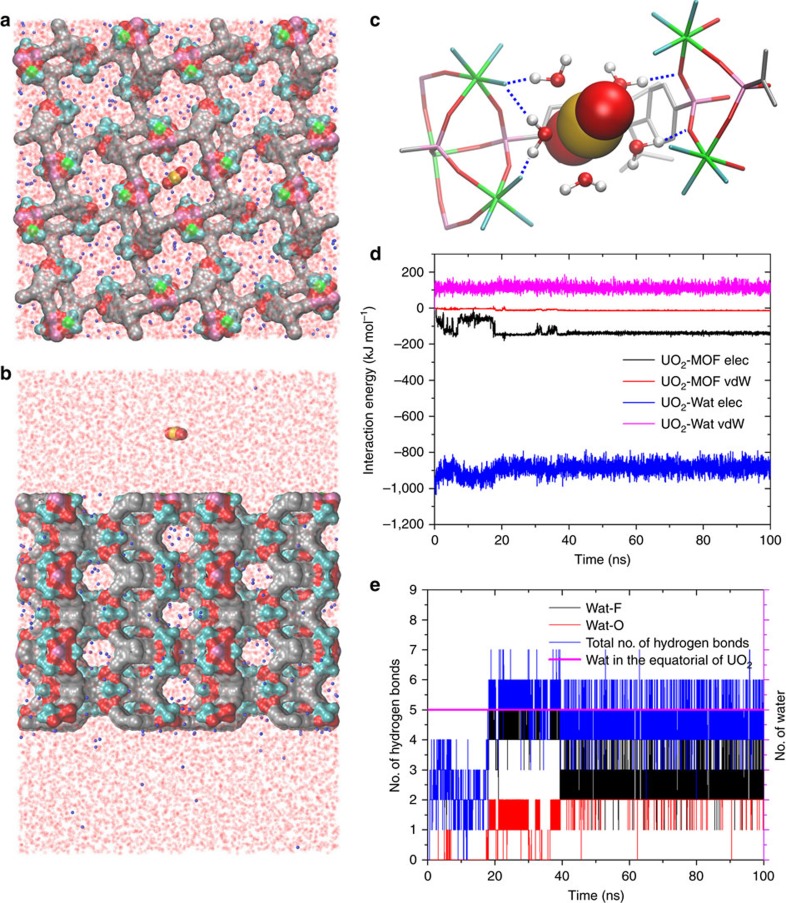
Figure 9. MD simulations on the process of uranyl sorption into SZ-2.
The top (a) and side (b) view of the simulation system-1 (uranyl cation approaching along the c axis); (c) the final snapshot (at t=100 ns) of run 1 (out of total 6) to show the importance of equatorial water of uranyl cation in mediating its binding to the SZ-2 (the blue dash line denotes the hydrogen bond between equatorial water molecules and the dangling hydrogen bond acceptors); (d) time evolution of the electrostatic and vdW interaction energies of uranyl cation with SZ-2 and water; (e) the number of equatorial water molecules of uranyl cation (pink curve) and the number of hydrogen bonds formed between equatorial coordinating water molecules and other acceptors (including F and O in main framework) as the function of simulation time.

