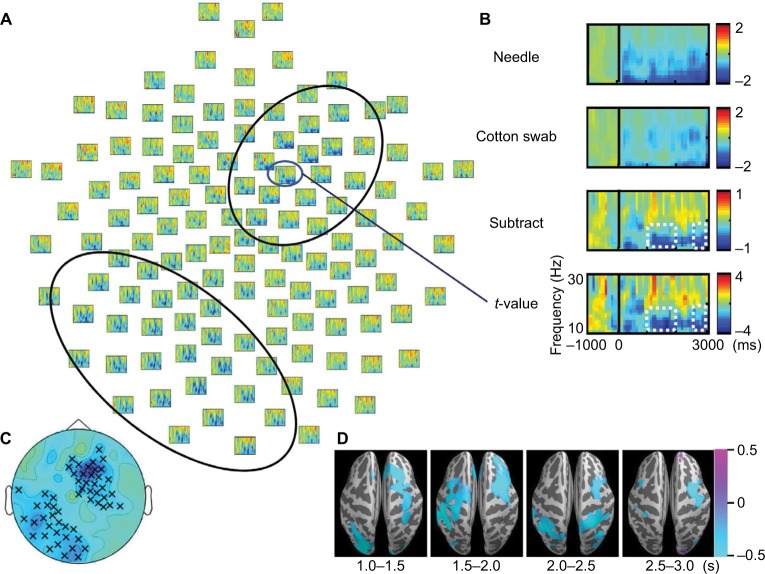
Figure 2.
t-value maps (needle condition vs. cotton swab condition) of the 128-ch electroencephalography (EEG) system. (A) Two significant clusters of electrodes estimated based on t-values are outlined by black oval lines. Induced α/β band activity was decreased in the needle condition over the right frontocentral and left parietooccipital regions. (B) The top (Needle) and second (Cotton swab) rows show the logarithmic-transformed power value normalized to that of the prestimulus period for needle and cotton swab conditions. The third (Subtract) row represents the subtracted value of the cotton swab condition from that of the needle condition. The bottom (t-value) row shows the t-value map of the t-test that compares the two conditions. Positive values mean that the value of the needle condition is greater, whereas negative values mean the opposite. The power suppression of the needle condition was enhanced between 200 and 3000 ms after movie onset for 10–16 Hz (white dotted line). (C) Significant clusters during the 1500–2000 ms segment are indicated by a multiplication sign (×). Right frontocentral and left parietooccipital clusters were confirmed by a cluster-based permutation test. (D) Source estimation was conducted on the standard brain using the beamformer method to analyze magnetoencephalography data for the same time and frequency window shown in EEG. Blue color indicates suppression of power values by the needle condition. The data are masked by t-values corresponding to p<0.05. The areas of α/β band suppression were distributed over the frontal and parietal lobes, and the desynchronization of α/β over the frontal lobe was lateralized to the right hemisphere, similar to EEG.

