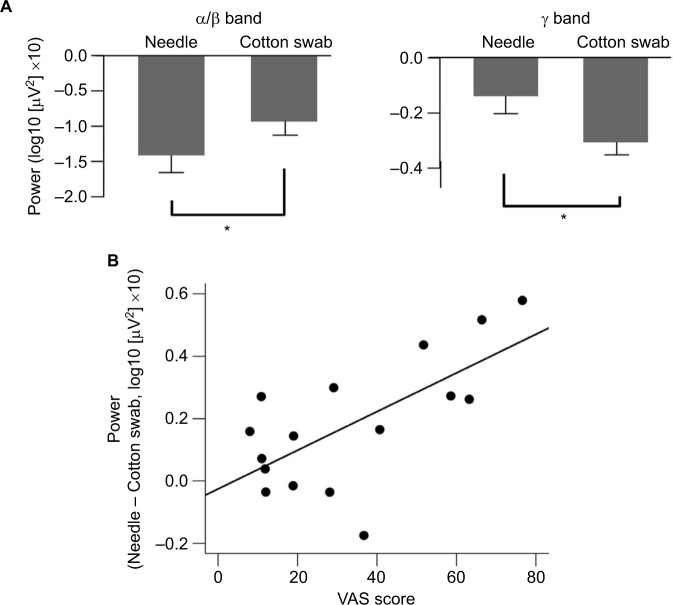
Figure 3.
Mean power of regions of interest (ROIs) of the needle and cotton swab conditions at α/β bands during 1500–2000 ms, and γ bands for 1000–1500 ms. (A) Error bars indicate standard error. Asterisks (*) indicate significant differences using one-sample t-test comparisons (p < 0.05). Relationship between the mean power of ROIs and the visual analog scale (VAS) subjective rating of aversion is shown. (B) The mean power of ROIs of the γ band was positively correlated with VAS scores (r = 0.624, p = 0.007).

