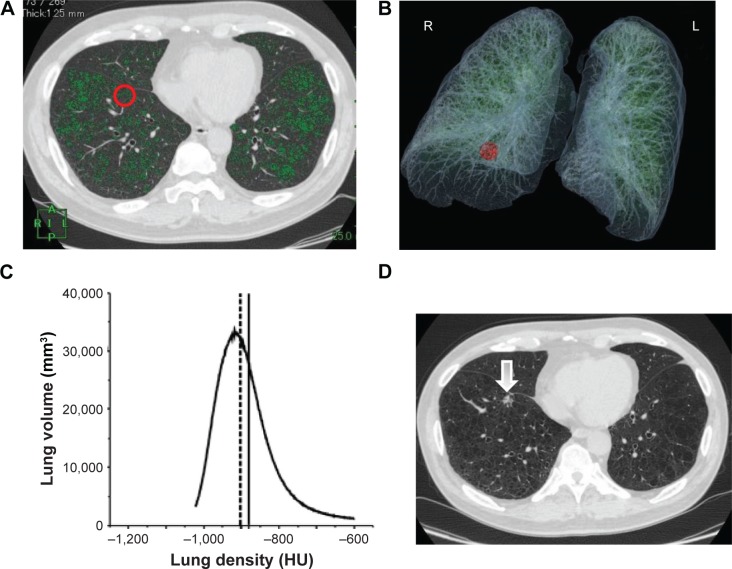
Figure 5.
Chest CT scans before and after the appearance of a malignant lesion and the histogram of lung density distribution in a patient who had emphysema, but no interstitial abnormalities.
Notes: (A) A transverse CT image at enrollment with superimposed LAA (<−95 HU: green). The red circle indicates the precancerous sphere. (B) The location of the sphere is visualized on 3D CT image (red circle). (C) Histogram of CT density distribution of the entire lungs. The area under the curve of the histogram is total lung volume. The median of whole lung density is indicated as a dotted line. The solid line indicates the local lung density of precancerous sphere. (D) A transverse CT image when a suspicious lesion (arrow) was detected at the same level of A.
Abbreviations: CT, computed tomography; LAA, low attenuation area; HU, Hounsfield unit; 3D, three dimensional; A, anterior; R, right; L, left; P, posterior.

