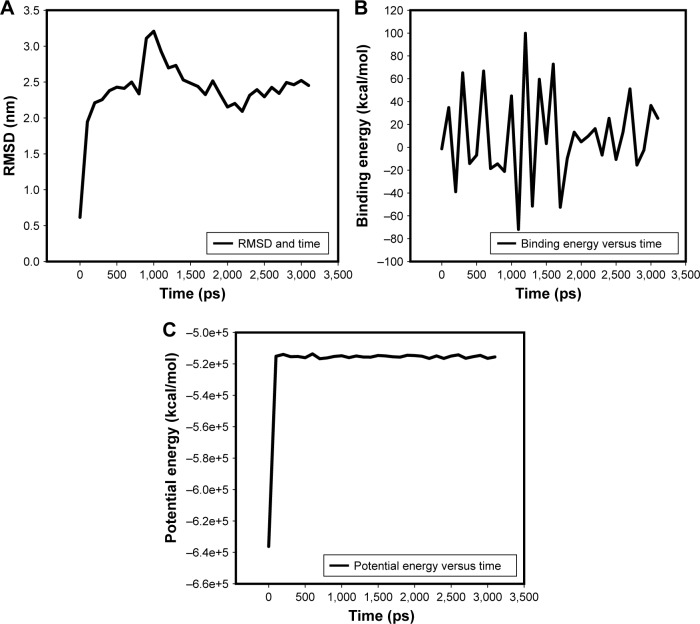
Figure 5.
The stability profile of ligand and protein complex under the MD simulation.
Notes: (A) Average RMSD versus time graph that shows the convergence of simulated structure toward an equilibrium state with respect to the reference structure (initial structure). (B) Potential energy of complex versus time graph that shows the stability of ligand and protein complex and (C) binding energy of complex versus time graph that also shows the stability of ligand and protein complex.
Abbreviations: MD, molecular dynamic; RMSD, root-mean-square deviation.

