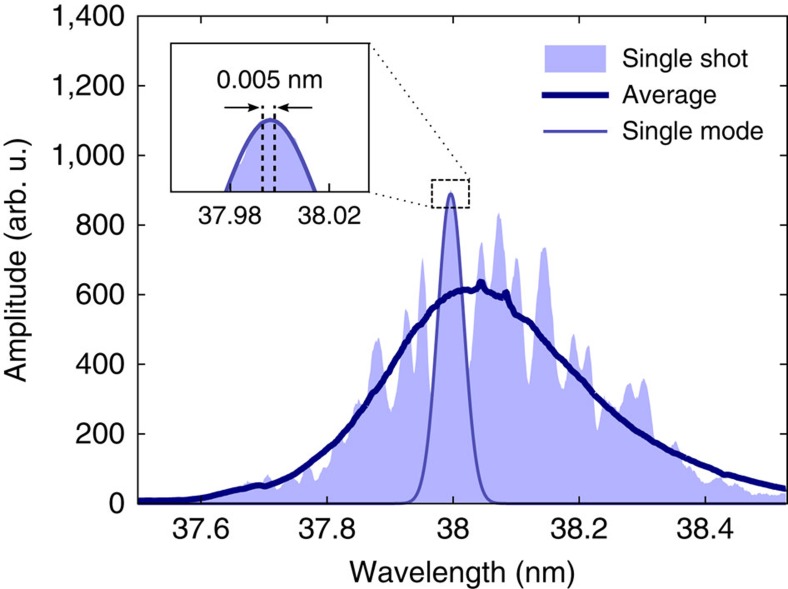
Figure 1. Spectral distribution of SASE FEL pulses.
A typical single-shot spectrum of self-amplified spontaneous emission (SASE) and the average spectrum of 1,800 pulses are shown. The free-electron laser (FEL) spectral bandwidth selected by the 70 μm wide monochromator exit slit is indicated in the inset. Individual longitudinal FEL modes have a significantly broader spectrum exemplified by the Gaussian fit, that is, the transmitted photon flux exhibits a high degree of longitudinal (temporal) coherence.

