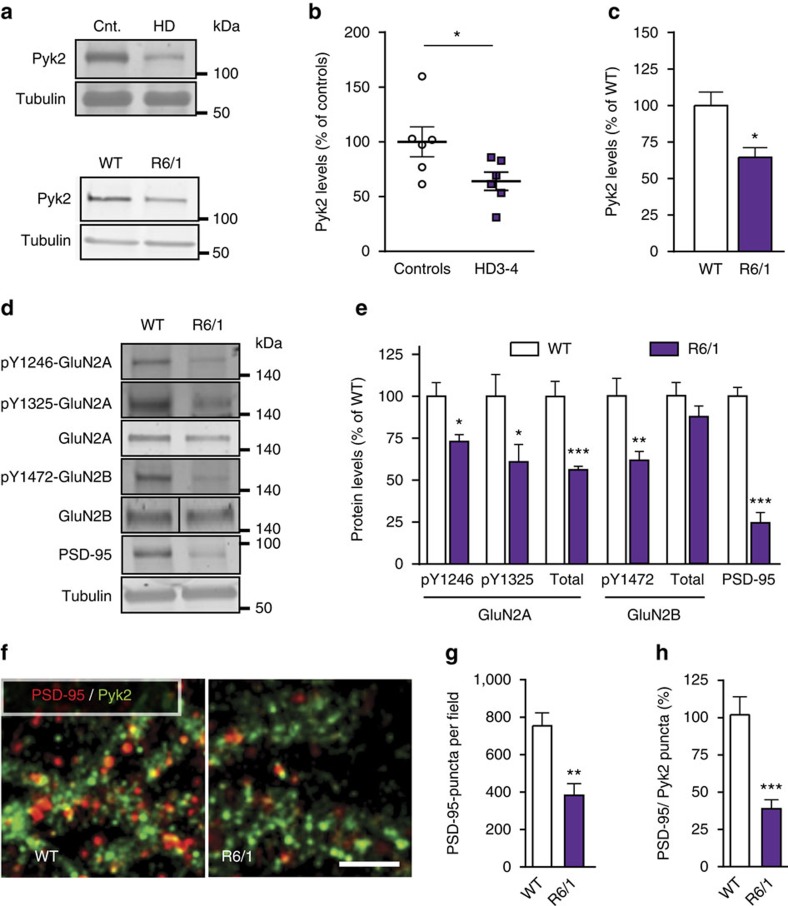
Figure 7. Hippocampal alterations of Pyk2 and synaptic markers in Huntington's disease.
(a) Hippocampal post-mortem samples from human patients grades 3–4 (HD3-4) and controls (Cnt., top panel) and from wild-type (WT) mice and R6/1 transgenic mice (lower panel) were analysed by immunoblotting for Pyk2 and α-tubulin as a loading control. Molecular weight marker positions are indicated in kDa. (b) Densitometric quantification of results as in a, for human samples expressed as a percentage of the mean in controls (n=6 per group, Student's t-test, t10=2.25, P<0.05). (c) Quantification of results as in a for WT and R6/1 mice (percentage of WT mean, n=4–6 mice per group, Student's t-test, t8=3.23, P=0.012). (d) Immunoblotting for phosphorylated forms and total GluN2A and GluN2B, and PSD-95 in hippocampus of WT and R6/1 mice. (e) Quantification of results as in d (percentage of WT mean), Student's t-test, pY1246-GluN2A, t9=3.10, P=0.013, pY1325-GluN2A, t9=2.37, P=0.04, GluN2A, t9=5.21, P=0.0006, pY1472-GluN2B, t8=3.64, P=0.0066, GluN2B, t8=1.22, P=0.26, PSD-95, t9=9.18, P<10−4. (f) Confocal images of the stratum radiatum of CA1hippocampal sections from WT and R6/1 mice immunolabelled for PSD95 (red) and Pyk2 (green). Scale bar, 10 μm. (g,h) Quantification of results as in f in (three slices per mouse, five–six mice per genotype. (g) Number of PSD95-positive puncta, Student's t-test, t9=3.98, P=0.003. (h) Number of Pyk2/PSD-95-double-positive puncta, expressed as a percentage of WT mean, Student's t-test, t10=4.66, P=0.0009. All data are means+s.e.m. *P<0.05, **P<0.01 and ***P<0.001. R6/1 mice were 5-month old. Uncropped blots for a and d are shown in Supplementary Figs 9 and 10, respectively.

