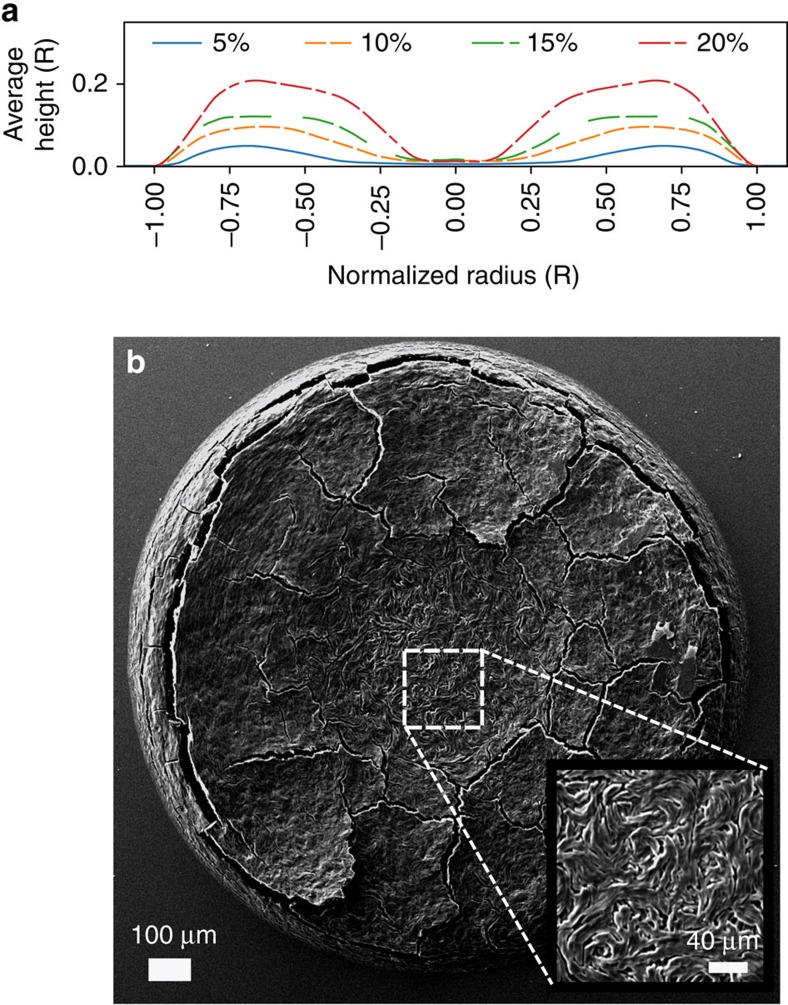
Figure 5. Drop deposits after drying: characterization.
(a) Profilometry results of dried droplets with varying initial weight concentrations of SSY. Drop size, or more precisely position within the drop, is normalized by the drop radius due to differences in spreading; all drops had a radius of ∼0.5 mm. (b) A scanning electron microscope image of a droplet of SSY on a coverslip dried in ambient conditions. The droplet had an initial concentration of 15% SSY by weight. The inner region (inset) of the droplet thins due to the convective flows during drying and locks in the turbulent flows present in the drop just before the transition to the more viscous LC phase.

