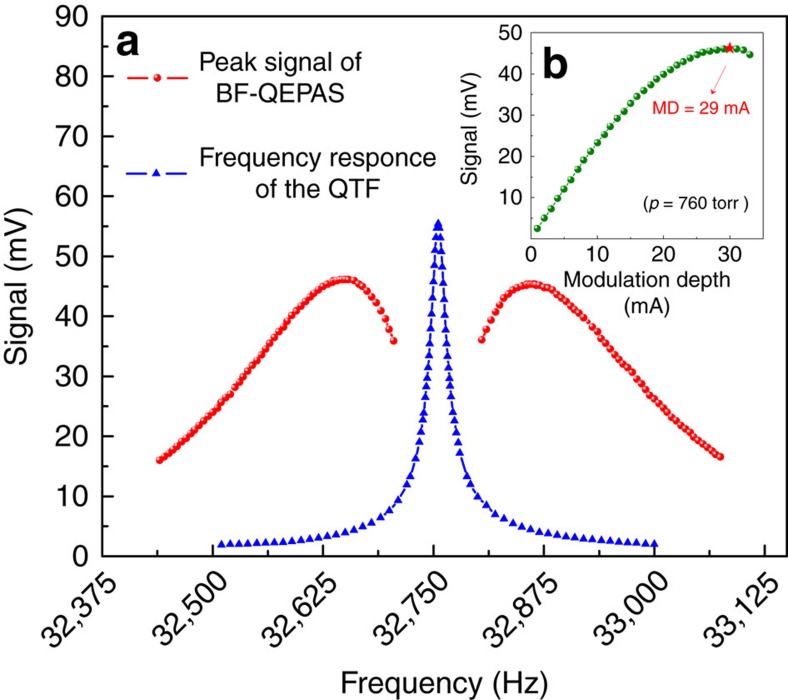
Figure 5. Qualitative representation of the QTF response curves.
(a) Red curve represents fits to the experimental data acquired via the BF-QEPAS technique, while the blue lines are fits to the peak value of the 2f signal generated by the conventional QEPAS technique. Both conventional QEPAS and BF-QEPAS signals are symmetrical and centred on the resonance frequency of the QTF. However, their maximum positions differ. The conventional QEPAS signal shows a Lorentzian-like behaviour. As a result, its maximum position is located at the resonance frequency of the QTF. The BF-QEPAS signal curve presents a two winged shape so that two maximum positions appear on both sides of the resonance frequency. (b) The amplitude of the beat signal as a function of the modulation depth (MD) current. The variation trend of the beat signal with the modulation depth increasing shows a similar behaviour as the conventional wavelength modulation technique. The signal amplitude rises when the modulation depth current is <29 mA. After reaching the maximum, the signal amplitude starts to decrease.

