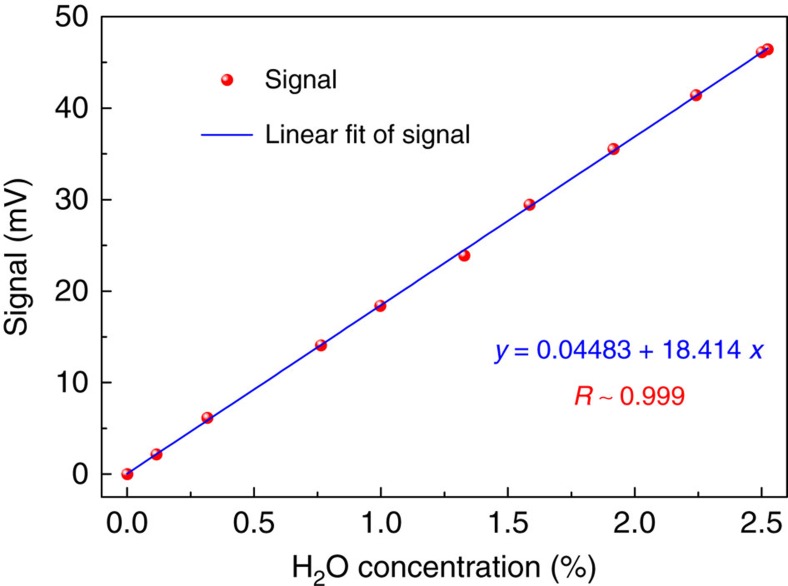
Figure 6. Linear dependence of the BF-QEPAS signal on H2O concentration levels.
The 1f-based BF-QEPAS signal was recorded as the H2O concentration levels were varied. For each concentration step, 50 readings of the BF-QEPAS signal were averaged to increase the accuracy of the result. The data was plotted as a function of H2O concentration, which confirms the linearity of the BF-QEPAS response to concentration.

