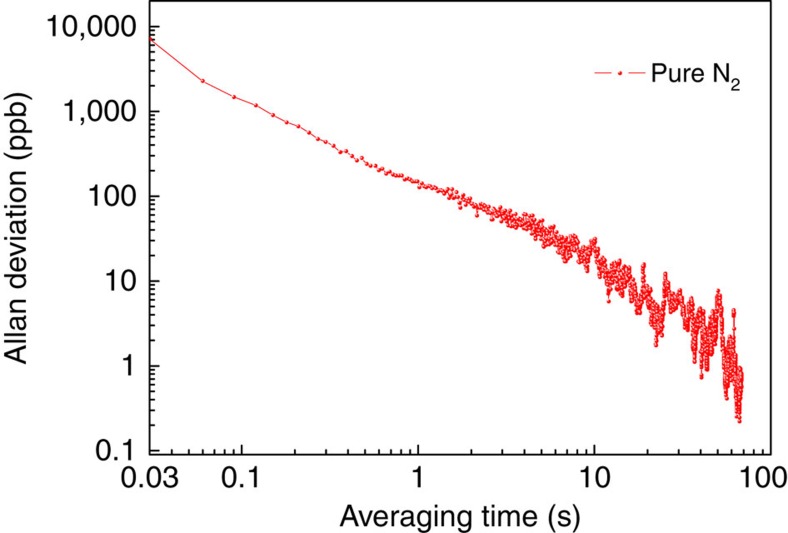
Figure 7. Allan–Werle deviation plot as a function of averaging time.
The background noise of the BF-QEPAS-based sensor was measured when the ADM was filled with pure N2. The LIA time constant and filter slope as well as the wavelength-scanning rate of the diode laser were set to optimized parameters, 100 μs, 12 dB and 36 cm−1 s−1, respectively.

