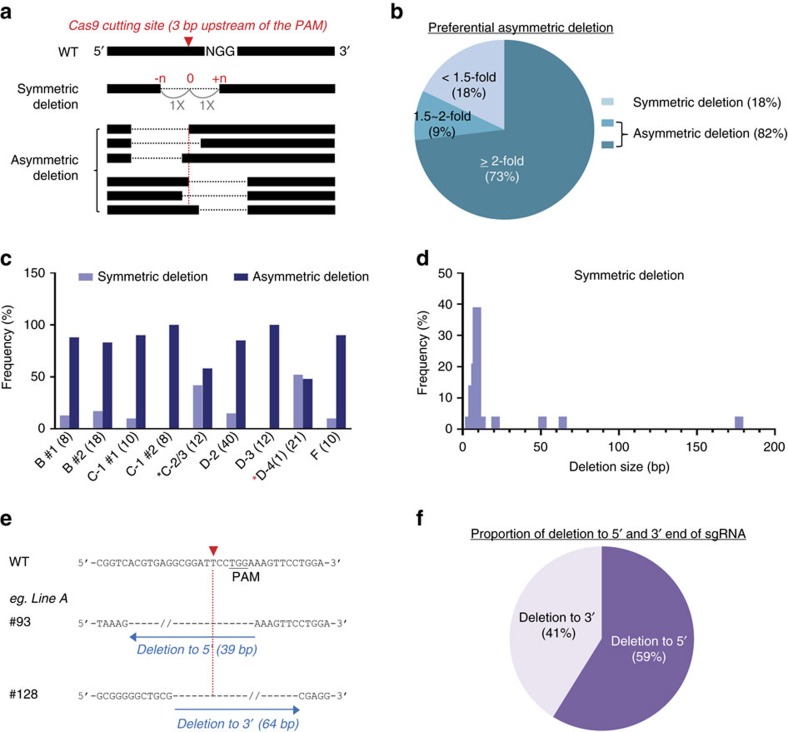
Figure 5. Asymmetric deletions.
(a) Schematic diagram of symmetric and asymmetric deletions detected in mice targeted with a single sgRNA. Red triangle, Cas9-cutting site three base pairs upstream of the PAM sequence. Symmetric deletions were defined as those with an equal or less than 1.5-fold ratio between the upstream and downstream Cas9-cutting site. In asymmetric deletions, the difference at either site was more than 1.5-fold than at the other site. (b) Percentage of symmetric and asymmetric deletions identified in CRISPR/Cas9-targeted mice (n=139). More than 80% of deletions were asymmetric and more than 70% of the deletions exceeded a two-fold difference. Only deletions obtained from a single sgRNA injection were analysed to avoid the effect of multiple variables. Deletions obtained from a single sgRNA injection: deletions targeting TF-binding site B, C-1, C-2/3, D-2, D-3, D-4(1) and F. (c) Ratio of symmetric and asymmetric deletions obtained with each sgRNA. B #1, n=8; B #2, n=18; C-1 #1, n=10; C-1 #2, n=8; C-2/3, n=12, D-2, n=40; D-3, n=12; D-4(1), n=21; F, n=10. Asterisk (*), sgRNAs with identical deletions identified in more than one half of the founders. (d) Frequency of symmetric deletions obtained with different deletion sizes. (e) Representative examples of deletions towards the 5′ end and 3′ end of sgRNA. If the deletion at the upstream Cas9-cutting site was longer (≥1.5-fold) than that at the downstream one, it was defined as a 5′ deletion and vice versa. (f) Percentage of deletions towards the 5′ end and 3′ end of sgRNA.

