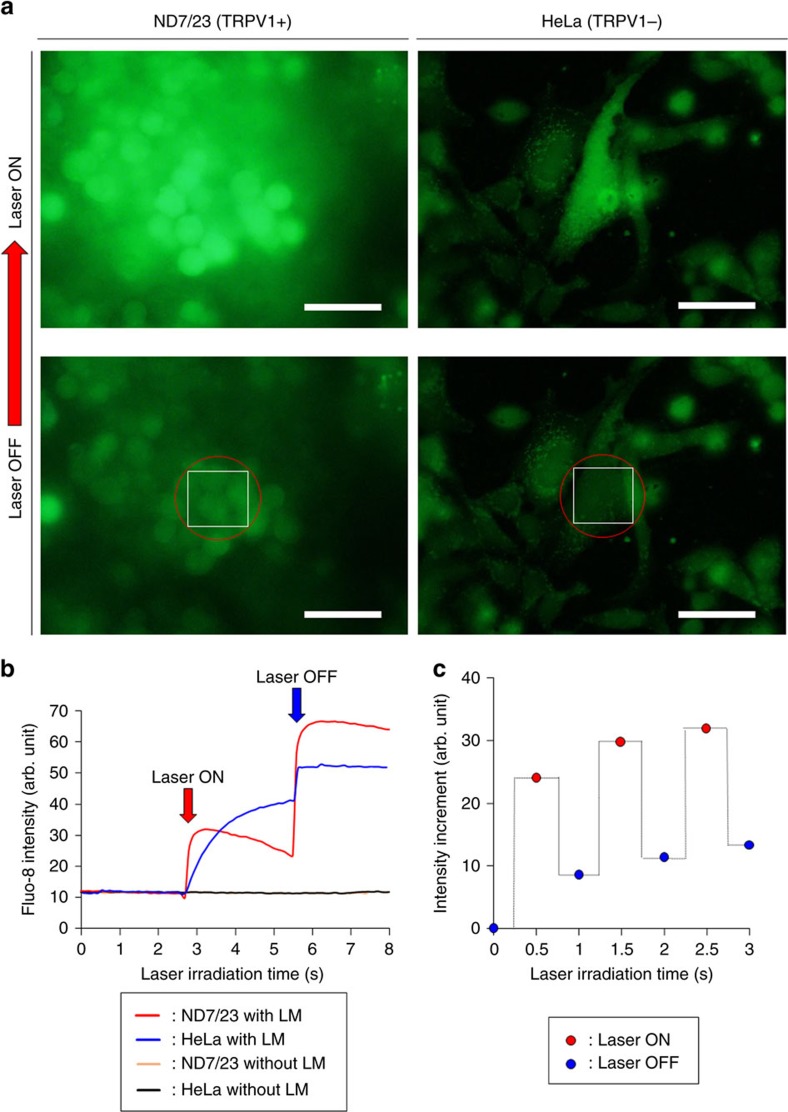
Figure 9. Cell stimulation by laser-induced LM nanocapsules.
(a) Calcium influx into ND7/23 and HeLa cells when exposed to a laser source (808 nm, 133 mW, ∼68 μW μm−2). The irradiated site is marked with a red circle. White squares show the analysed fluorescent intensity areas. Scale bars, 50 μm. (b) Quantification of fluorescence intensity over time. (c) Response to multiple laser irradiation events.

