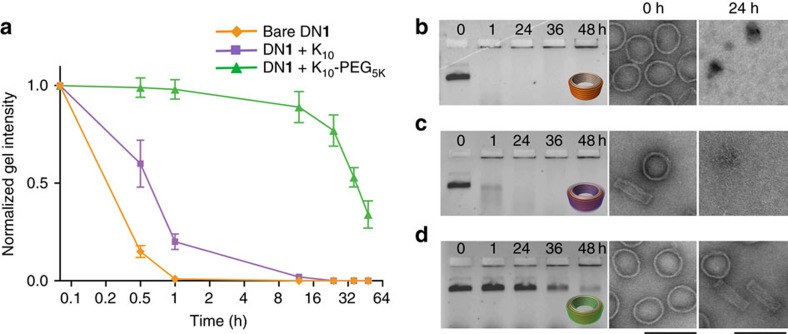
Figure 3. Time course of nuclease degradation of bare and coated DN1.
Digestion was assayed in freshly prepared cell medium (RPMI-1640 containing 10% FBS) at 37 °C. (a) Normalized agarose gel intensity vs. time for bare, K10 coated and K10–PEG5K-coated DN1. Time (hours) is plotted with log2 scaling and error bars represent s.d. (n=3 s). Agarose gel and negative-stain TEM images at 0 h and 24 h for (b) bare DN1, (c) K10-coated DN1 and (d) K10–PEG5K-coated DN1 incubated in freshly prepared primary BMDC medium at 37 °C. Scale bars, 100 nm.

