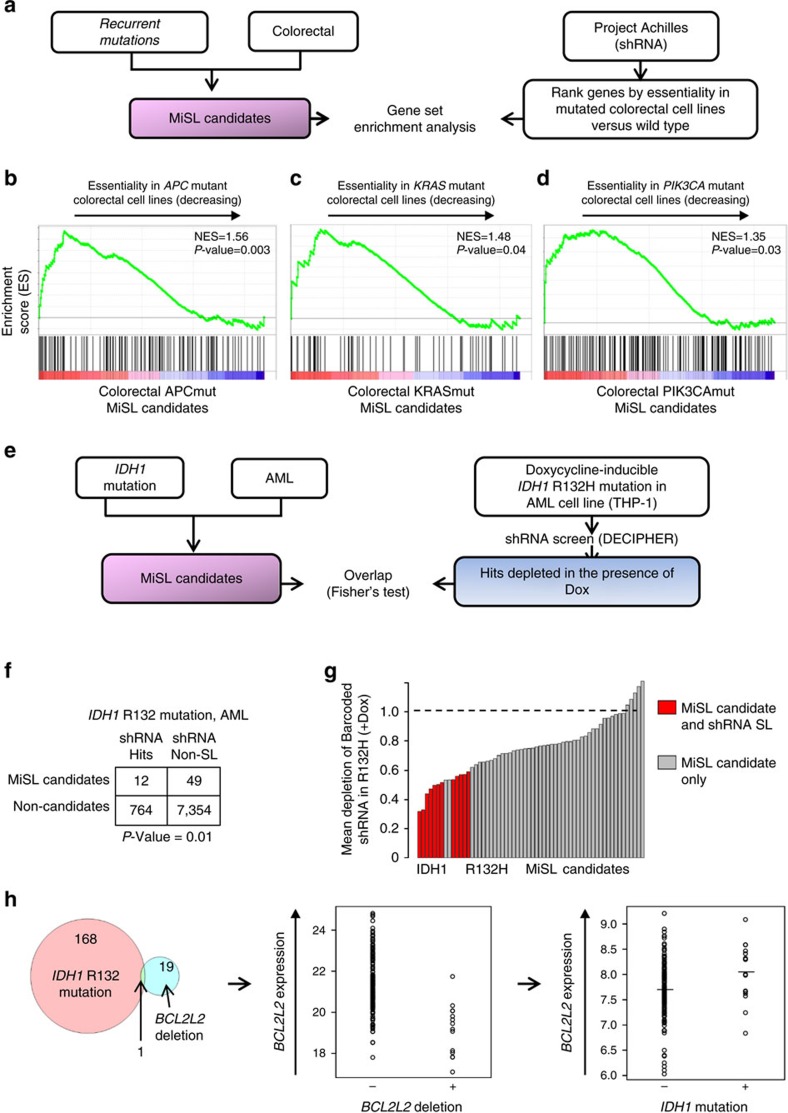
Figure 2. MiSL predictions are enriched for mutation-specific SL partners.
(a) Schematic for comparing MiSL predictions for mutations in colorectal cancer with essential genes as per the shRNA data from Project Achilles. (b–d) Gene set enrichment plots assessing the degree of enrichment of MiSL candidates for mutations in colorectal cancer using the data from Project Achilles. Genes were ranked according to selective essentiality in mutated colorectal cancer cell lines versus wild-type cells using the shRNA data from Project Achilles. Enrichment analysis was done using GSEA to compare the ranked list of genes for each mutation with its MiSL candidates in colorectal cancer. A positive enrichment score meant that MiSL candidates were ranked near the top of the list for each mutation. (b) Enrichment plot for APC mutation in colorectal cancer (NES=1.55, P value=0.003). (c) Enrichment plot for KRAS mutation in colorectal cancer (NES=1.48, P value=0.04). (d) Enrichment plot for PIK3CA mutation in colorectal cancer (NES=1.35, P value=0.03). (e) Schematic for comparing MiSL candidates for IDH1 mutation in AML with SL partners as per DECIPHER library screen generated using a Dox-inducible IDH1 R132H THP-1 cell line. (f) Overlap between MiSL candidates and SL partners as per the DECIPHER screen for the IDH1 mutation in AML is statistically significant (P value=0.01, Fisher's exact test). (g) Plot summarizing average shRNA scores for hairpins for the 61 MiSL candidates represented in the DECIPHER screen. (h) MiSL analysis steps illustrated for BCL2L2—(i) mutual exclusion of IDH1 mutation and gene deletion across cancers (HI-LO Boolean implication), (ii) deletion of gene concordant with lower expression of gene (P<0.05) and (iii) expression of gene is higher in IDH1-mutated AML (P<0.05).

