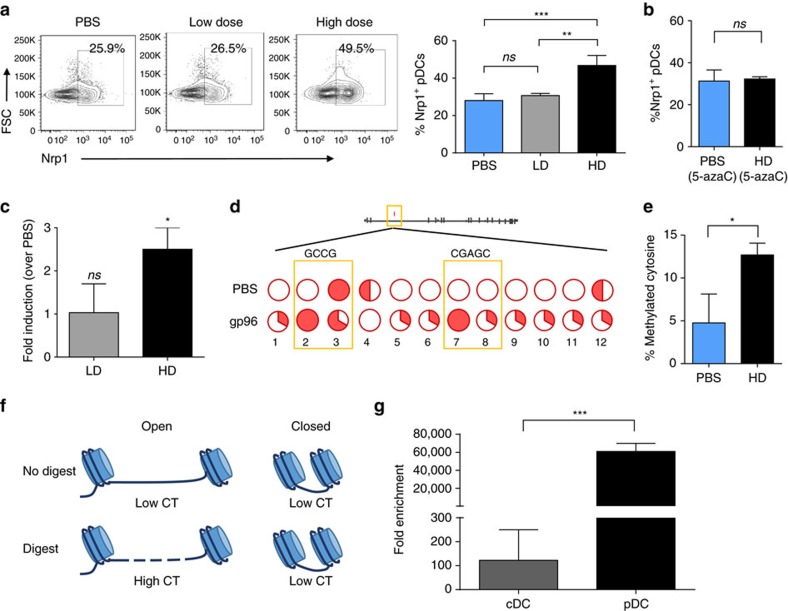
Figure 4. pDCs increase Nrp1 intronic methylation and protein expression in response to gp96 stimulation.
(a) Splenic pDCs were isolated, treated with low-dose (LD) or high-dose (HD) gp96 ex vivo, and Nrp1 expression was measured by flow cytometry. (b) Splenic pDCs were isolated from 5-azaC treated mice and stimulated with HD gp96 ex vivo for 18 h as in a. pDCs were stained with for pDC markers and Nrp1, and analysed by flow cytometry. Percent of Nrp1+ pDCs of total pDCs is shown. (c) Splenic pDCs were isolated, treated with low-dose (LD) or high-dose (HD) gp96 ex vivo, and Nrp1 expression was measured by qPCR. In a (bar graph), b,c, data are pooled from three independent experiments. (d) Schematic of methylation within Nrp1 at intron 2 from whole-genome methyl seq data. Splenic pDCs were isolated from naive mice and stimulated with high-dose (HD) gp96. Purified DNA was analysed by clonal bisulfite sequencing. Each line of bisulfite seq data represents one treatment group. Filled slices of the pie-charts signify methylated samples; open slices signify unmethylated samples. Only differentially methylated cytosines are shown; both CpG and non-CpG are included. (e) Percent of methylated cytosines of total cytosines as measured by clonal bisulfite sequences is shown. Data are from one representative experiment of two independent experiments. (f) Schematic of chromatin accessibility experiment. (g) Chromatin was purified splenic pDCs or cDCs isolated from naive mice and digested. Chromatin accessibility at the Nrp1 region of interest was assessed by qPCR. Fold enrichment was calculated using the formula: FE=2̂(NseCT-noNseCT) × 100%. n=3/group, data are pooled from three independent experiments. Data are represented as mean±s.d. ns not significant, *P<0.05, **P<0.01, ***P<0.001 (Student's t-test used in panels b,c,e,g; one-way ANOVA used in a).

