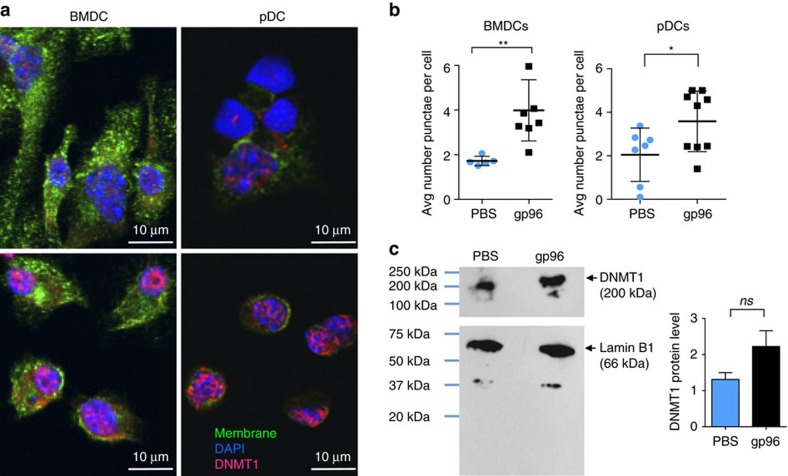
Figure 5. DNMT1 forms punctae in DC nuclei following gp96 stimulation.
(a) Indicated DCs were stimulated with gp96 or treated with PBS in vitro on coverslips for 6 h. Cells were stained and analysed by confocal microscopy. (b) DNMT1 punctae were quantified using NIS Elements software and in-house algorithms as described in Methods. Each point represents the average punctae per cell from one field of view. Data are from one representative experiment of three independent experiments. (c) Nuclear extracts from cDCs after 18 h gp96 stimulation were harvested for western blot analysis. Following transfer of nuclear extract protein from the gel to the western blot membrane, the membrane was cut in half horizontally. The top half was probed for DNMT1 and the bottom half was probed for Lamin B1 as a loading control. Data are from one representative experiment of three independent experiments. Data are represented as mean±s.d. ns, not significant, *P<0.05, **P<0.01 (Student's t-test).

