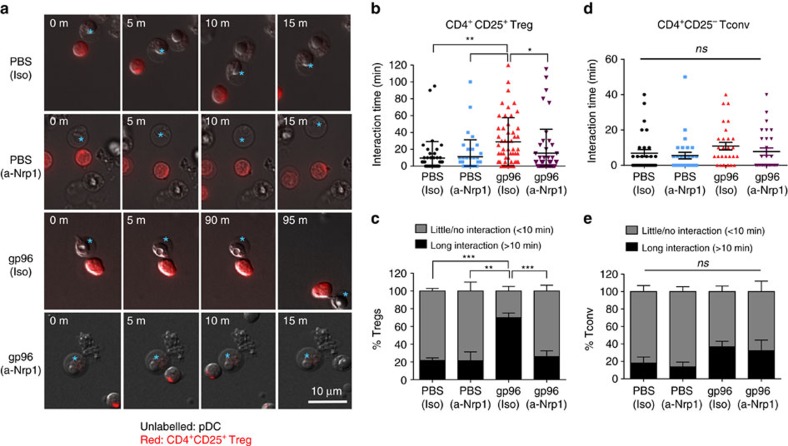
Figure 6. gp96-stimulated pDCs increase interaction with Treg in a Nrp1-dependent manner.
(a–e) Splenic pDCs were plated on coverslips with or without high-dose gp96, and in the presence or absence of Nrp1 blocking antibody (α-Nrp1) or isotype control antibody (Iso). Before imaging, Treg (CD4+CD25+) or Tconv (CD4+CD25−) were labelled with Cell Tracker Red dye and added to the pDC culture dishes at a 2:1 DC:T-cell ratio. Images were acquired at 5 min intervals for a total of 1–2 h. Interaction and motility were analysed. (b) Treg were tracked using NIS Elements tracking software. Representative Treg-pDC interactions are shown for each treatment group for the indicated times. The interaction times of Tregs with pDCs from multiple images are quantified. All Tregs (including those that failed to interact with pDC) are included. (c) The average percentage of Tregs which undergo long (>10 min) or short to no (0–10 min) interactions with pDCs were calculated for each group. (d,e) Tconv were analysed similarly to Treg. Total interaction time (d) and percentage of long interaction (e) are shown. All data are from one representative experiment of 2–3 independent experiments. Data are represented as mean±s.d. ns, not significant, *P<0.05, **P<0.01 (one-way ANOVA).

