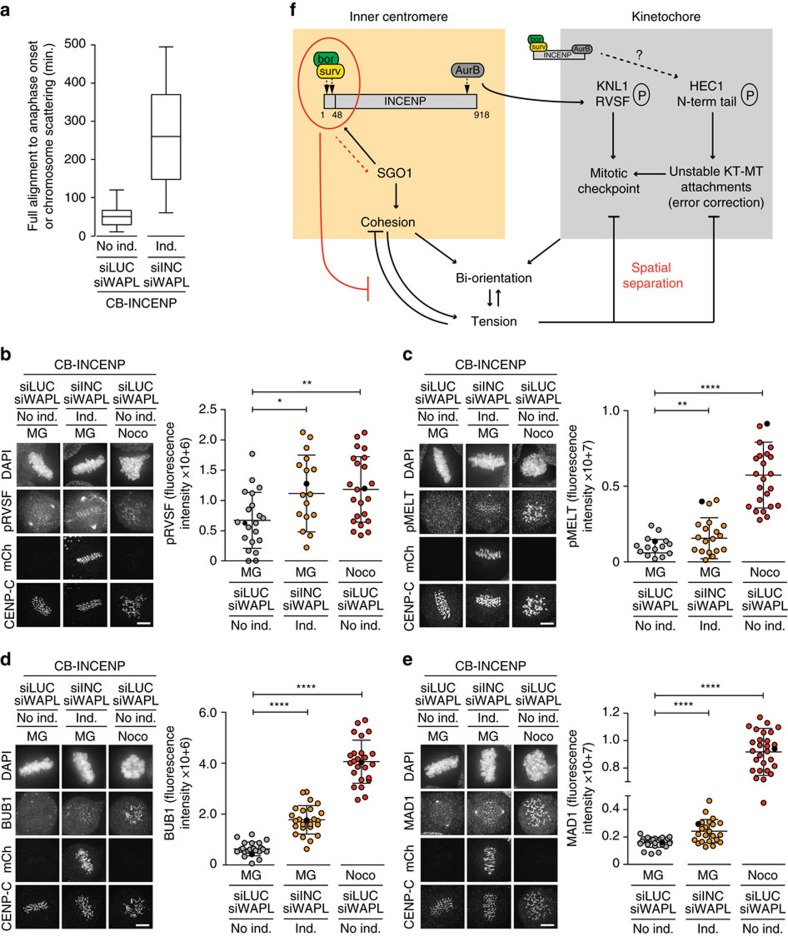
Figure 5. Spatial separation of Aurora B from KNL1 coordinates mitotic checkpoint silencing with bi-orientation.
(a) Time in metaphase for WAPL-and/or INCENP depleted cells±CB-INCENP (n=≥21 cells, see also Supplementary Fig. 4a–d). (b–e) IF of mCherry, CENP-C and KNL1-pRVSF-S60 (pRVSF) (b), KNL1-pMELT-T601 (pMELT) (c), BUB1 (d) and MAD1 (e) in cells±induction of CB-INCENP, transfected with indicated siRNAs and subjected to the bi-orientation assay. Quantifications of fluorescence intensities are shown on the right side of each panel (1 out of 2 exp., n=≥18 cells per condition, bars: mean±s.d., *P<0.05; **P<0.01; ****P<0.0001; unpaired t test, spindle poles were excluded from the quantifications). The corresponding data points of the images (scale bars, 5 μm) are coloured black in the graphs. (f) Model for how the CPC regulates the inner centromere and kinetochore to allow the build-up of tension upon bi-orientation, to counteract cohesion fatigue upon bi-orientation and tension, and to coordinate mitotic checkpoint silencing with chromosome bi-orientation.

