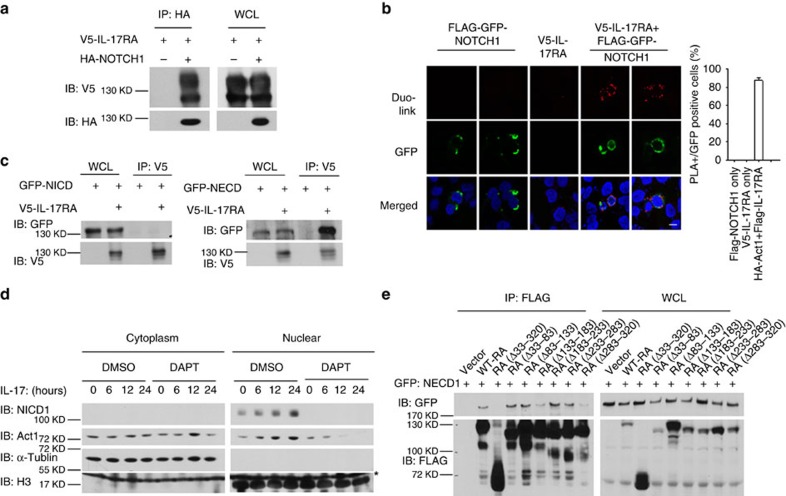
Figure 3. IL-17 activate NOTCH pathway through direct interaction between NOTCH1 and IL-17R.
(a) HEK293 cells were transfected with V5-IL-17RA alone or in combination with HA–NOTCH1. Cell lysates were immunoprecipitated with anti-HA antibody, followed by immunoblot analysis for indicated proteins. (b) HeLa cells were transfected with FLAG–GFP–NOTCH1 and V5-IL-17RA alone or in combination as indicated. In situ PLA were performed using rabbit anti-FLAG and mouse anti-V5 antibodies, followed by in situ proximity ligation and DAPI staining. Green: GFP (NOTCH1); red: PLA signal; blue: nuclei. Images were acquired using confocal microscopy under a × 60 objective; scale bar, 20 μm. Frequencies of PLA-positive cells in GFP-positive cells are shown in bar graph. (c) HEK293 cells were transfected with GFP–NICD1 (left panel) or NECD1 (right panel) with or without V5-IL-17RA. Cell lysates were immunoprecipitated with anti-V5 antibody, followed by immunoblot analysis for indicated proteins. (d) OPCs co-cultured with IL-17RA KO astrocytes were pretreated with DMSO or DAPT (10 μM) for 6 h. Pretreated cells were then stimulated with IL-17 (50 ng ml−1) for indicated times, followed by cytoplasm-nucleus fractionation. Cell fractionations were analysed by immunoblot for indicated proteins. Arrow indicates H3 bands and asterisk indicates non-specific band. (e) HEK293 cells were transfected with GFP–NECD1 in combination with vector or FLAG-tagged IL-17RA deletion mutants as indicated. Cell lysates were immunoprecipitated with anti-FLAG antibody, followed by immunoblot analysis for indicated proteins. IB, immunoblotting; IP, immunoprecipitation; WCL, whole-cell lysates. Error bars represent s.e.m. of technical replicates *P<0.05 based on Mann–Whitney U-test. Data are representative of three independent experiments.

