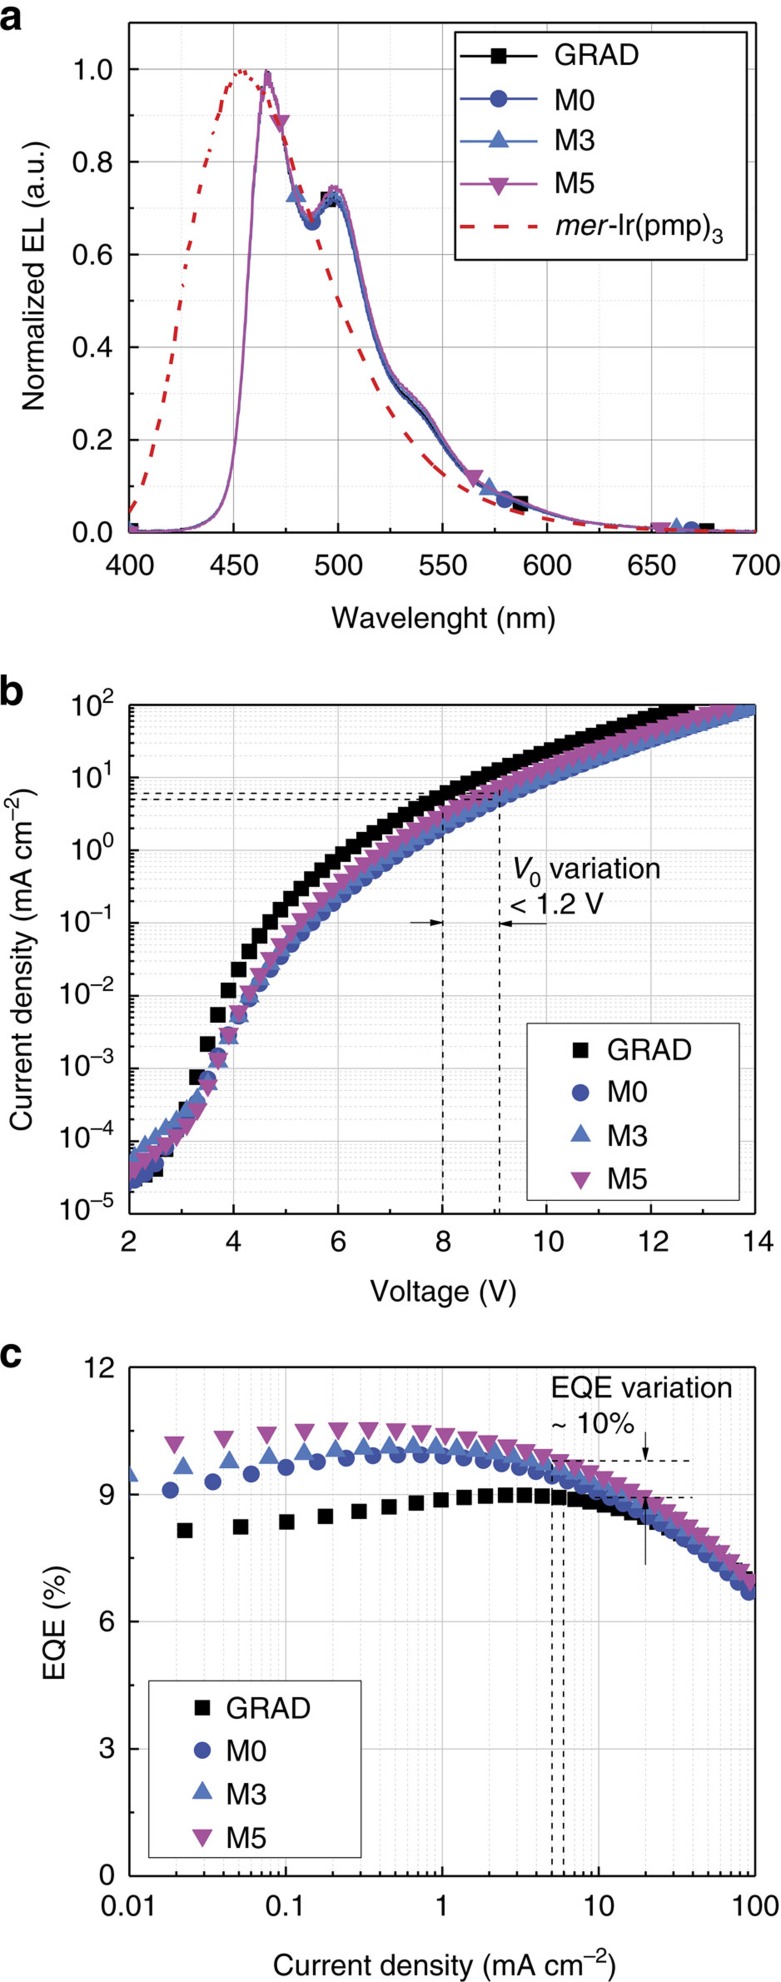
Figure 3. Performance of the PHOLEDs.
(a), Normalized electroluminescent (EL) spectra of the GRAD and managed PHOLEDs, M0, M3 and M5, measured at a current density of J0=5 mA cm−2. For comparison, the PL spectrum of the manager [mer-Ir(pmp)3] is also shown. (b) Current density–voltage. (c) External quantum efficiency (EQE)–current density characteristics of GRAD and selected managed PHOLEDs. Note that between GRAD and the managed PHOLEDs, the absolute difference of the operating voltages (V0) and EQE at an initial luminance of L0=1,000 cd m−2 for the lifetime test are <1.2 V and 1.0%, respectively.

