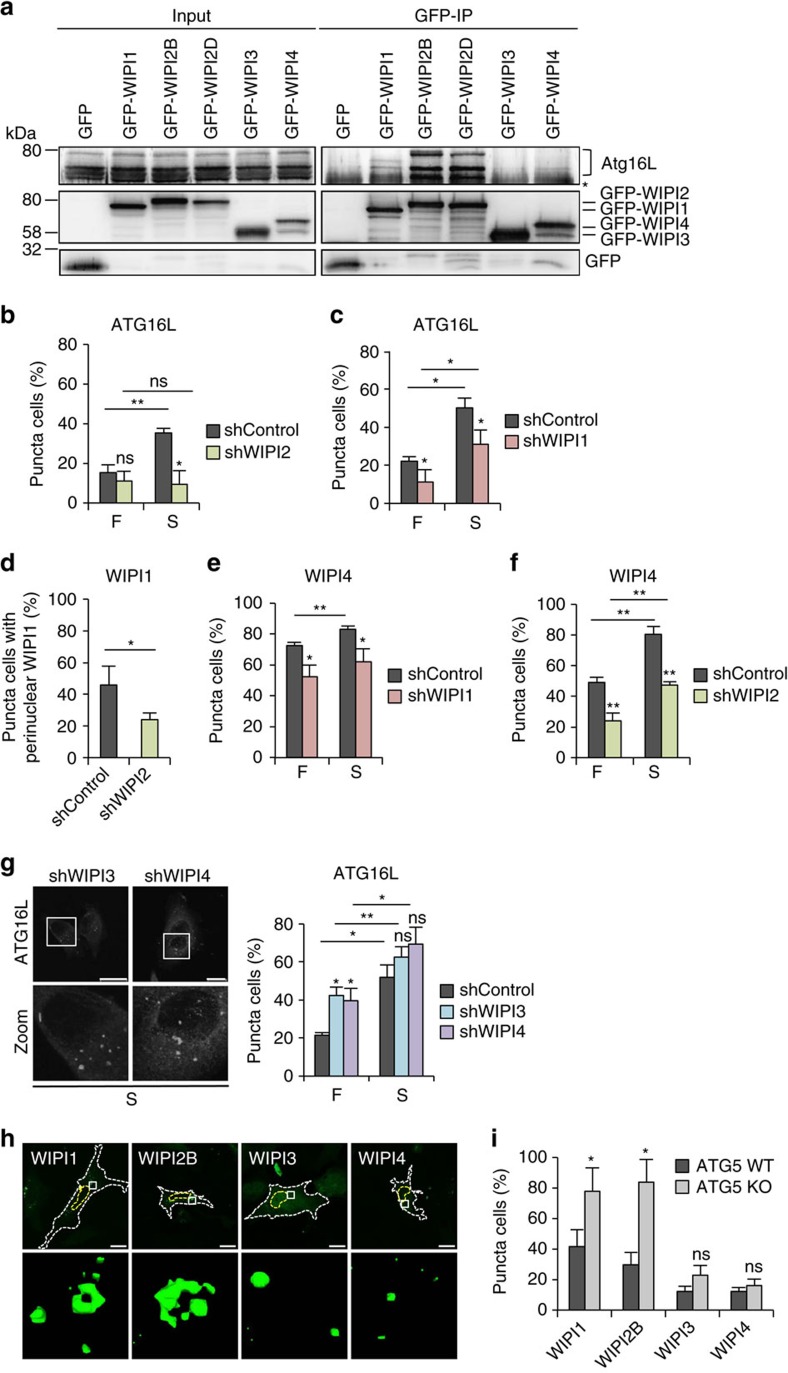
Figure 4. WIPI1 assists WIPI2 in recruiting ATG16L for LC3 lipidation.
(a) U2OS cells transiently expressing GFP-WIPI1, GFP-WIPI2B, GFP-WIPI2D, GFP-WIPI3, GFP-WIPI4 or GFP alone were starved for 3 h and analysed by anti-GFP immunoprecipitation followed by anti-GFP or anti-ATG16L immunoblotting. The asterisk in the right panel (GFP-IP) represents a nonspecific band. Endogenous ATG16L isoforms co-precipitated with GFP-WIPI1, GFP-WIPI2B and GFP-WIPI2D as indicated in the right panel. (b,c) G361 cells stably expressing shRNA targeting WIPI2 (b, shWIPI2), WIPI1 (c, shWIPI1) or the non-targeting control (shControl) were fed (F) or starved (S) for 3 h, and endogenous ATG16L was detected using anti-ATG16L/IgG-Alexa Fluor 488 antibodies and fluorescence microscopy. Mean percentages of ATG16L-puncta-positive cells (up to 369 individual cells per condition, n=3) are presented. (d) Monoclonal U2OS cells stably expressing GFP-WIPI1 and shWIPI2 or shControl were starved (S) for 3 h, and the percentage of cells displaying an accumulation of perinuclear GFP-WIPI1 was calculated using fluorescence microscopy. Mean values (400 cells per condition, n=4) are presented. (e,f) G361 cells stably expressing shRNAs targeting WIPI1 (e, shWIPI1) or WIPI2 (f, shWIPI2) were fed (F) or starved (S) for 3 h and immunostained using anti-WIPI4/IgG-Alexa Fluor 488 antibodies. Mean percentages of WIPI4-puncta-positive cells (up to 340 cells per condition, n=3) are presented. (g) G361 cells stably expressing shRNAs targeting WIPI3 (shWIPI3), WIPI4 (shWIPI4) or the non-targeting shRNA control (shControl) were fed (F) or starved (S) for 3 h and immunostained using anti-ATG16L/IgG-Alexa Fluor 488 antibodies for analysis by fluorescence microscopy (left panel). Mean percentages of ATG16L-puncta-positive cells (up to 387 cells per condition, n=3) are presented (right panel). (h,i) ATG5 wild-type (WT) or knockout (KO) mouse embryonic fibroblasts (MEFs) transiently expressing GFP-WIPI1, GFP-WIPI2B, GFP-WIPI3 or GFP-WIPI4 were analysed by confocal LSM, and images from ATG5 WT MEFs (h, upper panel) were processed using Volocity to generate 3D-reconstruction fly-through movies (Supplementary Movies 5–8), from which still images are presented (h, lower panel). Mean percentages of GFP-WIPI puncta-positive cells (300 cells, n=3). Mean±s.d.; heteroscedastic t-testing; P values: *P<0.05, ns: not significant. Scale bars: 20 μm. Statistics and source data can be found in Supplementary Data 1.

