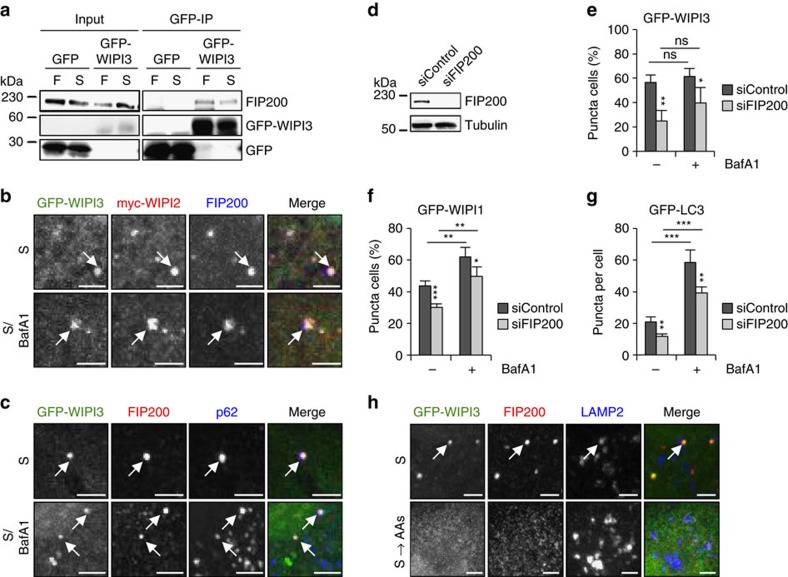
Figure 6. WIPI3 interacts with FIP200 at nascent autophagosomes and at LAMP2-positive lysosomes/late endosomes.
(a) Mouse embryonic fibroblasts transiently expressing GFP-WIPI3 or GFP alone were fed (F) or starved (S) for 3 h and analysed by immunoprecipitation using anti-GFP antibodies and anti-FIP200 or anti-GFP immunoblotting. (b) U2OS cells stably expressing GFP-WIPI3 were transfected with myc-WIPI2B and starved (S) in the absence or presence of BafA1 for 3 h. Cells were immunostained with anti-myc/IgG-Alexa Fluor 546 or anti-FIP200/IgG-Alexa Fluor 633 antibodies and visualized by confocal LSM. (c) U2OS cells stably expressing GFP-WIPI3 were starved (S) in the absence or presence of BafA1 for 3 h, immunostained with anti-FIP200/IgG-Alexa Fluor 546 and anti-p62/IgG-Alexa Fluor 633 antibodies and visualized by confocal LSM. (d,e) U2OS cells stably overexpressing GFP-WIPI3 were transfected with control siRNA or FIP200 siRNA. Subsequently, the cells were starved for 3 h in the absence or presence BafA1. FIP200 downregulation was confirmed by immunoblotting using anti-FIP200 and anti-tubulin antibodies (d). Mean percentages of GFP-WIPI3-puncta-positive cells (up to 481 cells per condition, n=4) are presented (e). (f) U2OS cells stably overexpressing GFP-WIPI1 were transfected with control siRNA or FIP200 siRNA. Subsequently, the cells were starved for 3 h with nutrient-free medium in the absence or presence BafA1. Using automated image acquisition and analysis, the mean percentages of GFP-WIPI1-puncta-positive cells (up to 5,856 cells per condition, n=4) were calculated. (g) In parallel, this experiment was conducted using GFP-LC3-expressing U2OS cells and mean numbers of GFP-LC3 puncta per cell (up to 4,798 cells per condition, n=4) calculated. (h) U2OS cells stably expressing GFP-WIPI3 were starved (S) for 2 h or starved and replenished with amino acids for 1 h (S→AAs). Subsequently, cells were immunostained with anti-FIP200/IgG-Alexa Fluor 546 and anti-LAMP2/IgG-Alexa Fluor 633 antibodies and visualized by confocal LSM. Image magnifications are presented (b,c,h) and co-localizations indicated with white arrows. Supplementary Material is available: Supplementary Fig. 6. Statistics and source data can be found in Supplementary Data 1. Mean±s.d.; heteroscedastic t-testing; P values: *P<0.05, **P<0.01, ***P<0.001, ns: not significant. Scale bars: 3 μm.

