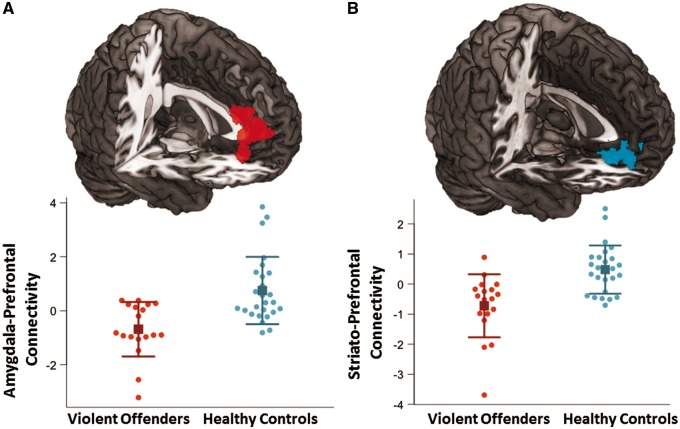
Fig. 4.
Group differences in amygdala and striatal functional connectivity in response to provocations. (A) Cluster in which bilateral amygdala functional connectivity was significantly greater in control subjects relative to violent offenders (k = 527 voxels, [18,42,32], z = 3.78). The corresponding plot below represents the extracted mean signal values from this cluster with means (squares) and standard deviations (error bars). (B) Cluster in which the bilateral striatum functional connectivity was significantly greater in control subjects relative to violent offenders (k = 349 voxels, [−10,40, −8], z = 3.69). The corresponding plot below represents the extracted mean signal values from this cluster with means (squares) and standard deviations (error bars).

