
FIGURE 5.
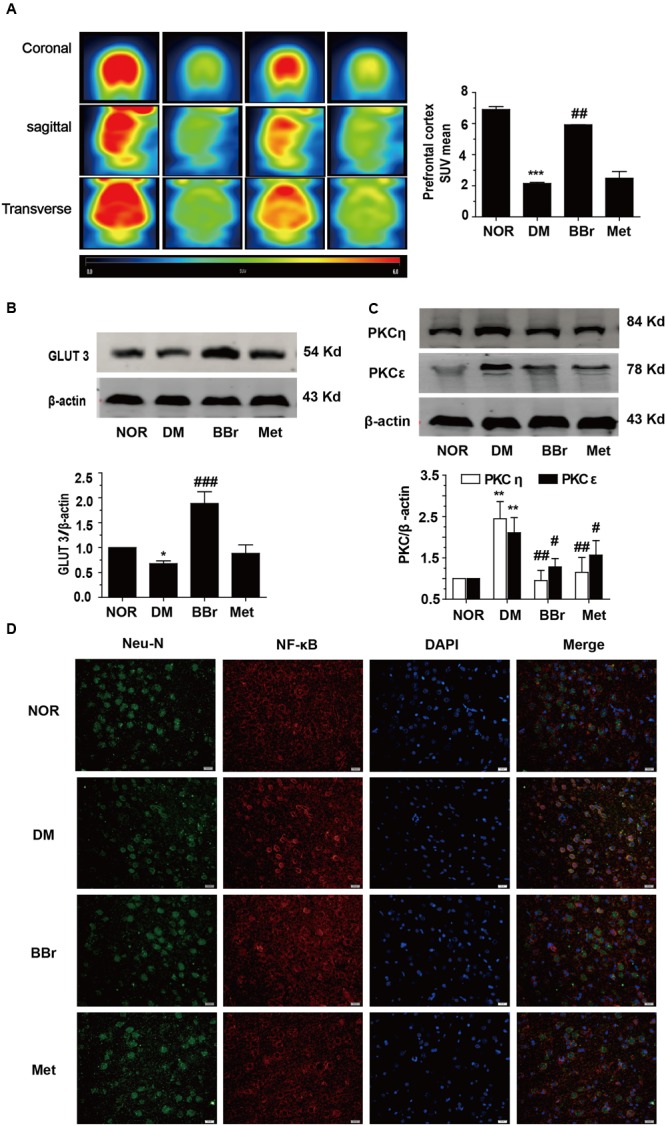
Uptake of glucose in rat brain and expression of GLUT3 in neuron of the mPFC. (A) The standard uptake value was described to evaluate the glucose uptake in vivo PET imaging. The standard uptake value mean was obviously augmented by BBr, n = 3 for PET imaging. (B) The down-regulation of the GLUT3 in the mPFC of DM rats was remarkably increased by BBr from Western blot showing, n = 3 for western-blot. (C) The expression of n-PKC in the mPFC of DM rats was remarkably inhibited by BBr, n = 3 for western-blot. (D) The translocation of NF-κB in the mPFC of DM rats was remarkably inhibited by BBr, n = 3 for immunofluorescence. ∗P < 0.05 vs. NOR; ∗∗∗P < 0.001 vs. NOR; ##P < 0.01 vs. DM.###P < 0.001 vs. DM.