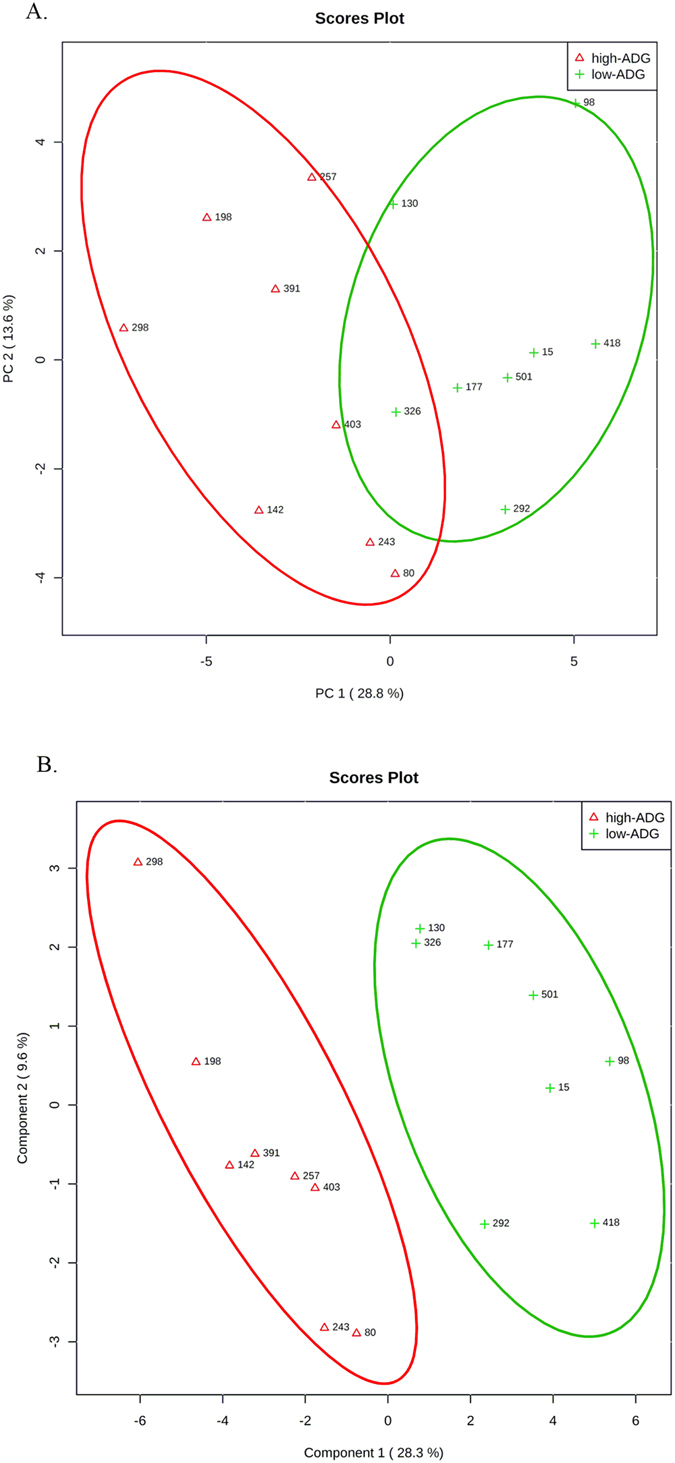
Figure 1.

Ruminal metabolomic profile of the steers with the greatest average daily gain (high-ADG; open red triangle) and the least ADG (low-ADG; green plus) with similar average dry matter intake. (A) Principal component analysis for UPLC-qTOF 90 metabolites identified to differ between ADG by t-test (P < 0.1). (B) Partial Least Square-Discriminant Analysis for UPLC-qTOF 90 metabolites identified to differ between ADG by t-test (P < 0.1). One data point represents one steer.
